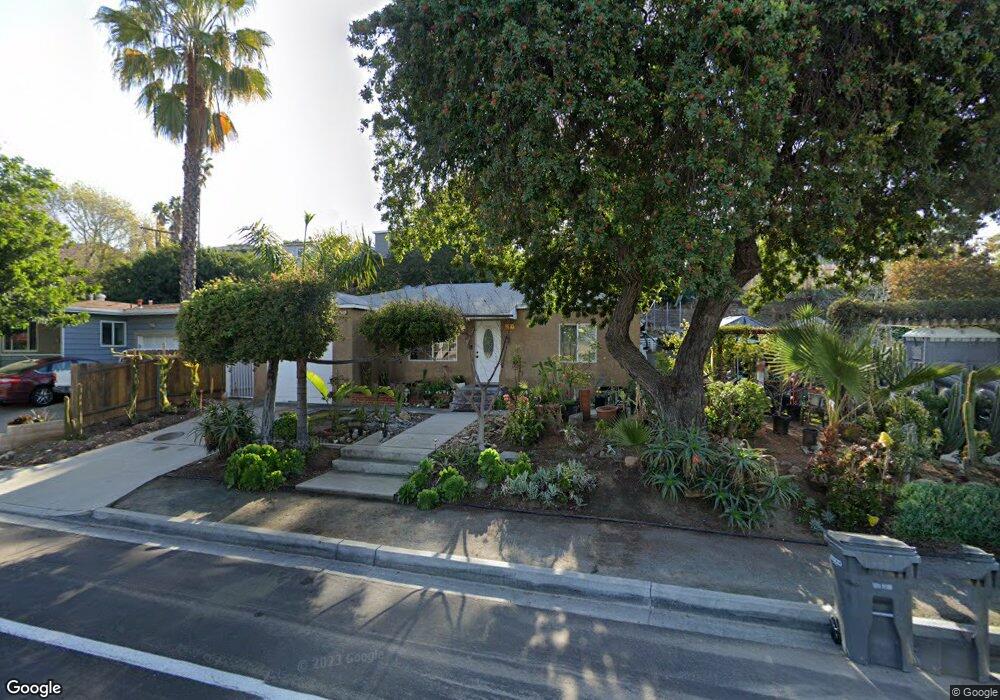
1819 Lemon Grove Ave Lemon Grove, CA 91945
Estimated Value: $594,000 - $661,000
2
Beds
1
Bath
836
Sq Ft
$747/Sq Ft
Est. Value
About This Home
This home is located at 1819 Lemon Grove Ave, Lemon Grove, CA 91945 and is currently estimated at $624,156, approximately $746 per square foot. 1819 Lemon Grove Ave is a home located in San Diego County with nearby schools including Monterey Heights Elementary, Mount Miguel High School, and Keiller Leadership Academy.
Ownership History
Date
Name
Owned For
Owner Type
Purchase Details
Closed on
Jun 2, 2021
Sold by
Lepe Rafael and Lepe Lilia
Bought by
Lepe Rafael and Lepe Lilia
Current Estimated Value
Purchase Details
Closed on
Mar 8, 1999
Sold by
Rafael Lepe
Bought by
Lepe Rafael and Lepe Lilia
Purchase Details
Closed on
Apr 11, 1996
Sold by
Ramirez Teresa
Bought by
Ramirez Alfredo
Home Financials for this Owner
Home Financials are based on the most recent Mortgage that was taken out on this home.
Original Mortgage
$74,100
Outstanding Balance
$2,892
Interest Rate
5.5%
Estimated Equity
$621,264
Purchase Details
Closed on
Apr 9, 1996
Sold by
Glendale Federal Bank
Bought by
Lepe Rafael and Lepe Lilia
Home Financials for this Owner
Home Financials are based on the most recent Mortgage that was taken out on this home.
Original Mortgage
$74,100
Outstanding Balance
$2,892
Interest Rate
5.5%
Estimated Equity
$621,264
Purchase Details
Closed on
Mar 11, 1996
Sold by
Lorenson James Douglas
Bought by
Glendale Federal Bank
Home Financials for this Owner
Home Financials are based on the most recent Mortgage that was taken out on this home.
Original Mortgage
$74,100
Outstanding Balance
$2,892
Interest Rate
5.5%
Estimated Equity
$621,264
Purchase Details
Closed on
Jul 28, 1994
Sold by
Lorenson Judith Marilyn
Bought by
Lorenson James Douglas
Create a Home Valuation Report for This Property
The Home Valuation Report is an in-depth analysis detailing your home's value as well as a comparison with similar homes in the area
Home Values in the Area
Average Home Value in this Area
Purchase History
| Date | Buyer | Sale Price | Title Company |
|---|---|---|---|
| Lepe Rafael | -- | Wfg Title | |
| Lepe Rafael | -- | -- | |
| Ramirez Alfredo | -- | Old Republic Title Company | |
| Lepe Rafael | $78,000 | Old Republic Title Company | |
| Glendale Federal Bank | $73,529 | Fidelity National Title Ins | |
| Lorenson James Douglas | -- | -- |
Source: Public Records
Mortgage History
| Date | Status | Borrower | Loan Amount |
|---|---|---|---|
| Open | Lepe Rafael | $74,100 |
Source: Public Records
Tax History Compared to Growth
Tax History
| Year | Tax Paid | Tax Assessment Tax Assessment Total Assessment is a certain percentage of the fair market value that is determined by local assessors to be the total taxable value of land and additions on the property. | Land | Improvement |
|---|---|---|---|---|
| 2025 | $2,303 | $144,498 | $66,433 | $78,065 |
| 2024 | $2,303 | $141,666 | $65,131 | $76,535 |
| 2023 | $2,254 | $138,889 | $63,854 | $75,035 |
| 2022 | $2,243 | $136,166 | $62,602 | $73,564 |
| 2021 | $2,218 | $133,497 | $61,375 | $72,122 |
| 2020 | $2,185 | $132,129 | $60,746 | $71,383 |
| 2019 | $2,144 | $129,539 | $59,555 | $69,984 |
| 2018 | $2,093 | $127,000 | $58,388 | $68,612 |
| 2017 | $150 | $124,511 | $57,244 | $67,267 |
| 2016 | $1,973 | $122,071 | $56,122 | $65,949 |
| 2015 | $1,962 | $120,238 | $55,279 | $64,959 |
| 2014 | $1,894 | $117,884 | $54,197 | $63,687 |
Source: Public Records
Map
Nearby Homes
- 1795 Lemon Grove Ave
- 1928 Noble St
- 1607 Watwood Rd
- 2108 El Prado Ave
- 2240-42 El Prado Ave
- 1701 Dayton Dr
- 1737-41 Glencoe Dr
- 2030 Fairhaven St
- 1942 Madera St
- 1015 Harlan Cir
- 1062 Armacost Rd
- 2127 Berry St
- 1915 Englewood Dr
- 7083 Berry Park Ln
- 0 Dartmoor Dr Unit 1
- 7065 Berry Park Ln
- 7015 Lermas Ct
- 1434 San Altos Place
- 7191 Dinovo St
- 2674 Buena Vista Ave
- 1837 Lemon Grove Ave
- 1804 Eldora St
- 1786 Eldora St
- 1786 El Dora St
- 1816 Noble St Unit 18
- 1830 Noble St
- 1859 Lemon Grove Ave
- 1775 Lemon Grove Ave
- 1774 Eldora St
- 1774 & 177 Eldora St
- 1846 Noble St
- 1869 Lemon Grove Ave
- 1759 Lemon Grove Ave
- 1795 El Dora St
- 1795 Eldora St #97
- 1795 Eldora St Unit 97
- 1852 Noble St
- 1883 Lemon Grove Ave
- 1803 Eldora St
- 1868 Noble St