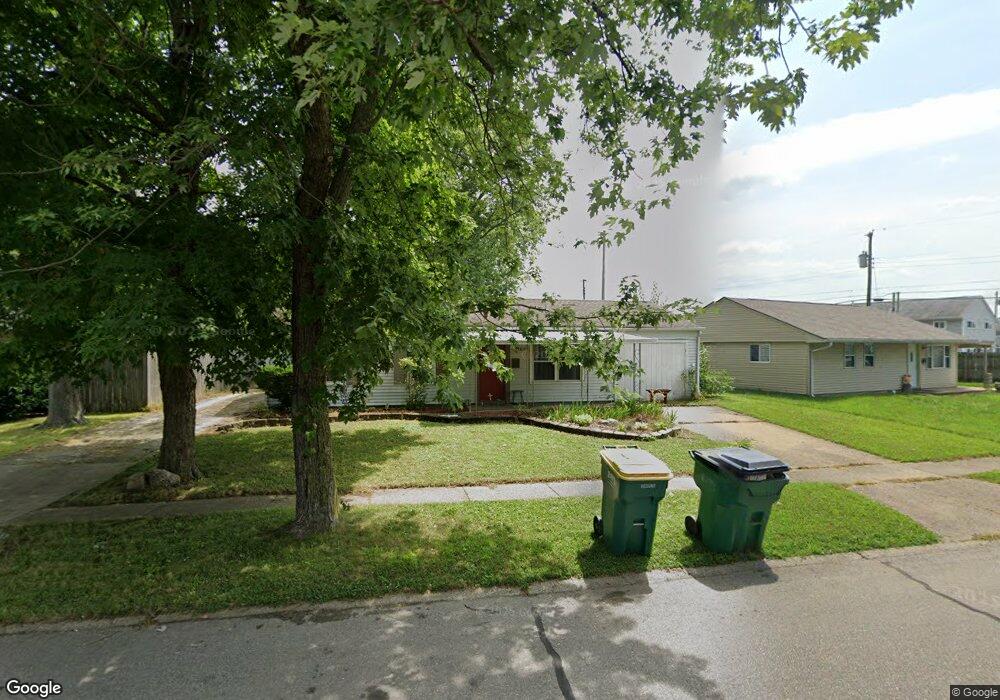
1819 Lochry Rd Franklin, IN 46131
Estimated Value: $164,000 - $184,000
3
Beds
1
Bath
1,176
Sq Ft
$147/Sq Ft
Est. Value
About This Home
This home is located at 1819 Lochry Rd, Franklin, IN 46131 and is currently estimated at $173,167, approximately $147 per square foot. 1819 Lochry Rd is a home located in Johnson County with nearby schools including Northwood Elementary School, Franklin Community Middle School, and Custer Baker Intermediate School.
Ownership History
Date
Name
Owned For
Owner Type
Purchase Details
Closed on
Dec 16, 2005
Sold by
Epler Kristin
Bought by
Wise Chadwick E
Current Estimated Value
Home Financials for this Owner
Home Financials are based on the most recent Mortgage that was taken out on this home.
Original Mortgage
$88,609
Outstanding Balance
$50,135
Interest Rate
6.48%
Mortgage Type
FHA
Estimated Equity
$123,032
Purchase Details
Closed on
Jun 27, 2005
Sold by
The Secretary Of Hud
Bought by
Epler Kristin
Home Financials for this Owner
Home Financials are based on the most recent Mortgage that was taken out on this home.
Original Mortgage
$63,200
Interest Rate
9%
Mortgage Type
Future Advance Clause Open End Mortgage
Purchase Details
Closed on
Jan 31, 2005
Sold by
Chase Home Finance Llc
Bought by
Secretary Of Hud
Purchase Details
Closed on
Nov 1, 2004
Sold by
Randy Chappelow Bank One N A
Bought by
Chase Manhattan Mortgage Corp
Create a Home Valuation Report for This Property
The Home Valuation Report is an in-depth analysis detailing your home's value as well as a comparison with similar homes in the area
Home Values in the Area
Average Home Value in this Area
Purchase History
| Date | Buyer | Sale Price | Title Company |
|---|---|---|---|
| Wise Chadwick E | -- | Chicago Title Ins Co | |
| Epler Kristin | -- | None Available | |
| Secretary Of Hud | -- | None Available | |
| Chase Manhattan Mortgage Corp | $60,692 | None Available |
Source: Public Records
Mortgage History
| Date | Status | Borrower | Loan Amount |
|---|---|---|---|
| Open | Wise Chadwick E | $88,609 | |
| Previous Owner | Epler Kristin | $63,200 |
Source: Public Records
Tax History
| Year | Tax Paid | Tax Assessment Tax Assessment Total Assessment is a certain percentage of the fair market value that is determined by local assessors to be the total taxable value of land and additions on the property. | Land | Improvement |
|---|---|---|---|---|
| 2025 | $1,083 | $128,400 | $20,600 | $107,800 |
| 2024 | $1,083 | $110,700 | $20,600 | $90,100 |
| 2023 | $1,104 | $105,000 | $20,600 | $84,400 |
| 2022 | $977 | $93,400 | $20,600 | $72,800 |
| 2021 | $822 | $82,100 | $20,600 | $61,500 |
| 2020 | $875 | $80,700 | $18,400 | $62,300 |
| 2019 | $849 | $77,500 | $10,000 | $67,500 |
| 2018 | $721 | $69,300 | $10,000 | $59,300 |
| 2017 | $718 | $68,800 | $10,000 | $58,800 |
| 2016 | $617 | $64,200 | $10,000 | $54,200 |
| 2014 | $633 | $62,600 | $14,300 | $48,300 |
| 2013 | $633 | $65,300 | $14,300 | $51,000 |
Source: Public Records
Map
Nearby Homes
- 1860 Churchill Rd
- 1046 Ebony Cir
- 2000 Acorn Rd
- 1996 Acorn Rd Unit 2000
- 1985 Falcon Ct
- 2002 Falcon Ct
- 1712 Turning Leaf Dr
- 1212 Crabapple Rd
- 1194 Grassy Creek Cir
- 1220 Harvest Ridge Cir
- 925 Mallory Pkwy
- 1664 Woodside Cir
- 698 Yandes St
- 601 Duane St
- 801 Hurricane St
- 198 W King St
- 750 Hurricane St
- 1195 S Aberdeen Dr
- 1408 Crabapple Rd
- 2139 Bridlewood Dr
- 1809 Lochry Rd
- 20 Lochry Ct
- 30 Lochry Ct
- 1830 Lochry Rd
- 118 Schoolhouse Rd Unit 122
- 102 Schoolhouse Rd Unit 106
- 1820 Lochry Rd
- 1812 Lochry Rd
- 158 Schoolhouse Rd Unit 160
- 136 Schoolhouse Rd Unit 138
- 1802 Lochry Rd
- 40 Lochry Ct
- 1838 Lochry Rd
- 94 Schoolhouse Rd Unit 98
- 164 Schoolhouse Rd
- 1855 Lochry Rd
- 60 Lochry Ct
- 115 Schoolhouse Rd Unit 119
- 50 Lochry Ct
- 101 Schoolhouse Rd Unit 105
Your Personal Tour Guide
Ask me questions while you tour the home.