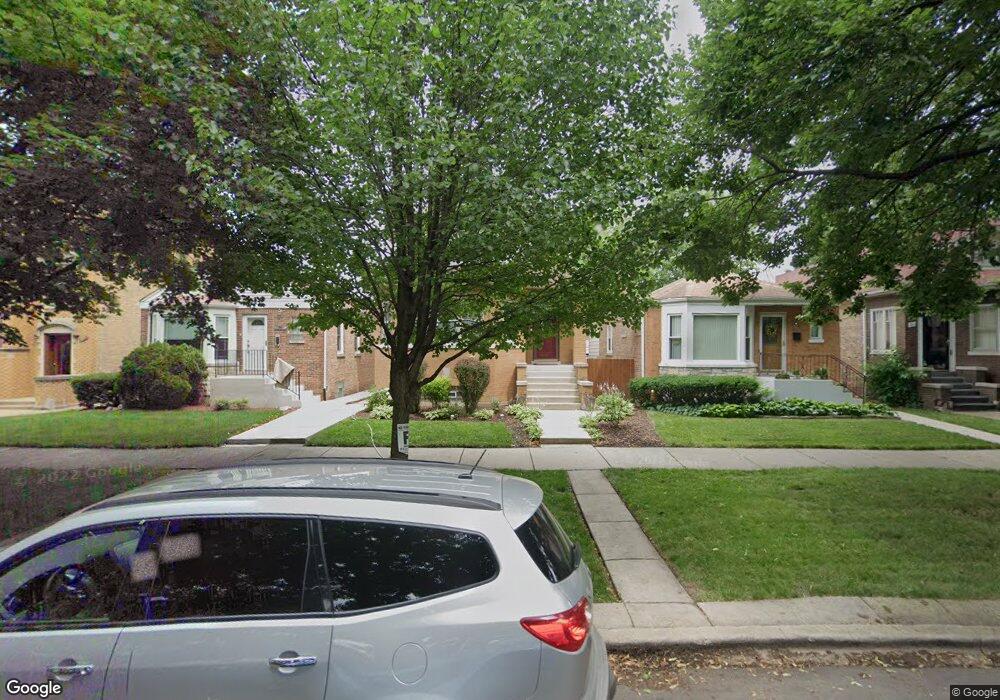
1819 N Nashville Ave Chicago, IL 60707
Galewood NeighborhoodEstimated Value: $473,000 - $596,269
4
Beds
3
Baths
2,932
Sq Ft
$180/Sq Ft
Est. Value
About This Home
This home is located at 1819 N Nashville Ave, Chicago, IL 60707 and is currently estimated at $528,317, approximately $180 per square foot. 1819 N Nashville Ave is a home located in Cook County with nearby schools including Lovett Elementary School, Steinmetz College Prep, and Acero - Roberto Clemente Elementary School.
Ownership History
Date
Name
Owned For
Owner Type
Purchase Details
Closed on
Feb 21, 1998
Sold by
Coleman Dana L
Bought by
Harris Lacey and Harris Yolanda D
Current Estimated Value
Home Financials for this Owner
Home Financials are based on the most recent Mortgage that was taken out on this home.
Original Mortgage
$137,200
Outstanding Balance
$24,180
Interest Rate
6.95%
Estimated Equity
$504,137
Purchase Details
Closed on
Dec 5, 1996
Sold by
Reller Doris J
Bought by
Harris Lacey and Harris Yolanda D
Home Financials for this Owner
Home Financials are based on the most recent Mortgage that was taken out on this home.
Original Mortgage
$135,850
Interest Rate
7.66%
Purchase Details
Closed on
Sep 15, 1993
Sold by
Favoino Mark J and Favoino Marion H
Bought by
Reller Doris J
Home Financials for this Owner
Home Financials are based on the most recent Mortgage that was taken out on this home.
Original Mortgage
$129,200
Interest Rate
7.22%
Create a Home Valuation Report for This Property
The Home Valuation Report is an in-depth analysis detailing your home's value as well as a comparison with similar homes in the area
Home Values in the Area
Average Home Value in this Area
Purchase History
| Date | Buyer | Sale Price | Title Company |
|---|---|---|---|
| Harris Lacey | -- | -- | |
| Harris Lacey | $143,000 | Attorneys Natl Title Network | |
| Reller Doris J | $90,666 | -- |
Source: Public Records
Mortgage History
| Date | Status | Borrower | Loan Amount |
|---|---|---|---|
| Open | Harris Lacey | $137,200 | |
| Previous Owner | Harris Lacey | $135,850 | |
| Previous Owner | Reller Doris J | $129,200 |
Source: Public Records
Tax History Compared to Growth
Tax History
| Year | Tax Paid | Tax Assessment Tax Assessment Total Assessment is a certain percentage of the fair market value that is determined by local assessors to be the total taxable value of land and additions on the property. | Land | Improvement |
|---|---|---|---|---|
| 2024 | $7,178 | $48,000 | $16,089 | $31,911 |
| 2023 | $6,997 | $34,000 | $12,975 | $21,025 |
| 2022 | $6,997 | $34,000 | $12,975 | $21,025 |
| 2021 | $6,841 | $34,000 | $12,975 | $21,025 |
| 2020 | $8,216 | $36,859 | $6,487 | $30,372 |
| 2019 | $8,326 | $41,415 | $6,487 | $34,928 |
| 2018 | $8,186 | $41,415 | $6,487 | $34,928 |
| 2017 | $7,766 | $36,055 | $5,709 | $30,346 |
| 2016 | $7,225 | $36,055 | $5,709 | $30,346 |
| 2015 | $7,040 | $38,396 | $5,709 | $32,687 |
| 2014 | $6,697 | $36,068 | $5,190 | $30,878 |
| 2013 | $6,565 | $36,068 | $5,190 | $30,878 |
Source: Public Records
Map
Nearby Homes
- 1700 N Natoma Ave
- 1639 N Normandy Ave
- 1937 N Normandy Ave
- 1733 N Oak Park Ave
- 1227 N East Ave
- 1627 N Narragansett Ave
- 1221 Edmer Ave
- 1701 N Newland Ave
- 1600 N New England Ave Unit 4
- 1104 Fair Oaks Ave
- 1212 N Harvey Ave
- 1122 N Ridgeland Ave
- 1130 N Grove Ave
- 1221 Hayes Ave
- 1715 N Meade Ave
- 1905 N Nordica Ave
- 1143 Woodbine Ave
- 1009 N Oak Park Ave
- 102 Le Moyne Pkwy
- 2311 N Natchez Ave
- 1823 N Nashville Ave
- 1817 N Nashville Ave
- 1811 N Nashville Ave
- 1825 N Nashville Ave
- 1829 N Nashville Ave
- 1809 N Nashville Ave
- 1831 N Nashville Ave
- 1807 N Nashville Ave
- 1835 N Nashville Ave
- 1805 N Nashville Ave
- 1837 N Nashville Ave
- 1801 N Nashville Ave
- 1818 N Natchez Ave
- 1820 N Natchez Ave
- 1816 N Natchez Ave
- 1824 N Natchez Ave
- 1812 N Natchez Ave
- 1841 N Nashville Ave
- 1828 N Natchez Ave
- 1818 N Nashville Ave