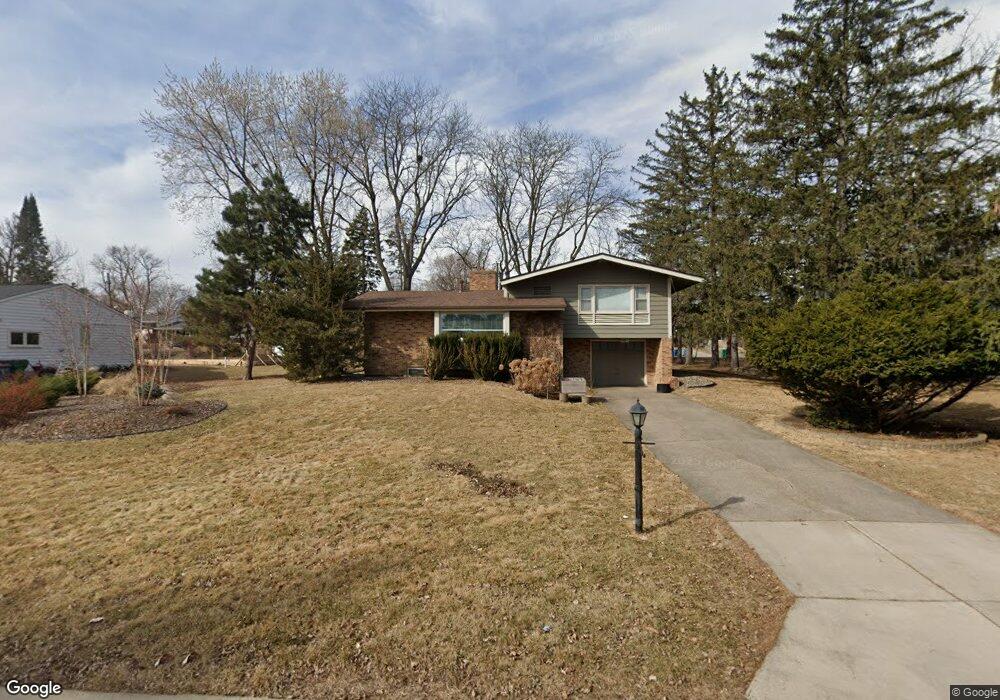
1819 Spring Valley Cir Golden Valley, MN 55422
Estimated Value: $398,000 - $485,000
2
Beds
2
Baths
1,168
Sq Ft
$375/Sq Ft
Est. Value
About This Home
This home is located at 1819 Spring Valley Cir, Golden Valley, MN 55422 and is currently estimated at $438,392, approximately $375 per square foot. 1819 Spring Valley Cir is a home located in Hennepin County with nearby schools including Noble Elementary School, Plymouth Middle School, and Armstrong High School.
Ownership History
Date
Name
Owned For
Owner Type
Purchase Details
Closed on
Jul 31, 2015
Sold by
Busack Alex and Busack Ashley
Bought by
Busack Alex and Busack Ashley
Current Estimated Value
Home Financials for this Owner
Home Financials are based on the most recent Mortgage that was taken out on this home.
Original Mortgage
$213,750
Outstanding Balance
$167,596
Interest Rate
4.02%
Mortgage Type
New Conventional
Estimated Equity
$270,796
Purchase Details
Closed on
Jul 21, 2015
Sold by
Kaganovich Yuriy and Gusovskaya Inna
Bought by
Busack Alex
Home Financials for this Owner
Home Financials are based on the most recent Mortgage that was taken out on this home.
Original Mortgage
$213,750
Outstanding Balance
$167,596
Interest Rate
4.02%
Mortgage Type
New Conventional
Estimated Equity
$270,796
Purchase Details
Closed on
Dec 7, 1995
Sold by
Ettel Stephen
Bought by
Yurly Kaganovich
Create a Home Valuation Report for This Property
The Home Valuation Report is an in-depth analysis detailing your home's value as well as a comparison with similar homes in the area
Home Values in the Area
Average Home Value in this Area
Purchase History
| Date | Buyer | Sale Price | Title Company |
|---|---|---|---|
| Busack Alex | -- | Stewart Title Of Minnesota | |
| Busack Alex | $225,000 | Stewart Title Of Minnesota | |
| Yurly Kaganovich | $116,500 | -- |
Source: Public Records
Mortgage History
| Date | Status | Borrower | Loan Amount |
|---|---|---|---|
| Open | Busack Alex | $213,750 |
Source: Public Records
Tax History Compared to Growth
Tax History
| Year | Tax Paid | Tax Assessment Tax Assessment Total Assessment is a certain percentage of the fair market value that is determined by local assessors to be the total taxable value of land and additions on the property. | Land | Improvement |
|---|---|---|---|---|
| 2024 | $5,911 | $397,500 | $179,600 | $217,900 |
| 2023 | $5,364 | $374,400 | $156,800 | $217,600 |
| 2022 | $4,969 | $366,000 | $155,000 | $211,000 |
| 2021 | $4,323 | $331,000 | $152,000 | $179,000 |
| 2020 | $4,232 | $290,000 | $119,000 | $171,000 |
| 2019 | $3,961 | $273,000 | $136,000 | $137,000 |
| 2018 | $3,917 | $245,000 | $114,000 | $131,000 |
| 2017 | $3,757 | $225,000 | $89,000 | $136,000 |
| 2016 | $3,632 | $225,000 | $109,000 | $116,000 |
| 2015 | $3,896 | $238,000 | $122,000 | $116,000 |
| 2014 | -- | $195,000 | $91,000 | $104,000 |
Source: Public Records
Map
Nearby Homes
- 4930 Winsdale St N
- 1465 Island Dr
- 1325 Spring Valley Rd
- 2001 Toledo Ave N
- 1540 Waterford Ct
- 5131 Thotland Rd
- 2670 Quail Ave N
- 2543 Unity Ave N
- 5740 Golden Valley Rd
- 2641 Kyle Ave N
- 4850 Dona Ln
- 4920 Dawnview Terrace
- 2805 Regent Ave N
- 6140 Golden Valley Rd
- 2941 Noble Ave N
- 6020 Wynnwood Rd
- 1350 Douglas Dr N Unit 105
- 2300 Zenith Ave N
- 2130 Douglas Dr N
- 2923 France Ave N
- 1823 Spring Valley Cir
- 1815 Spring Valley Cir
- 1811 Spring Valley Cir
- 1820 Spring Valley Cir
- 1817 Spring Valley Rd
- 1816 Spring Valley Cir
- 1824 Spring Valley Cir
- 1813 Spring Valley Rd
- 1821 Spring Valley Rd
- 1840 Spring Valley Cir
- 1836 Spring Valley Cir
- 1812 Spring Valley Cir
- 1807 Spring Valley Rd
- 1825 Spring Valley Rd
- 1832 Spring Valley Cir
- 4839 Golden Valley Rd
- 4725 Golden Valley Rd
- 1835 Noble Dr N
- 1800 Spring Valley Cir
- 1801 Spring Valley Rd