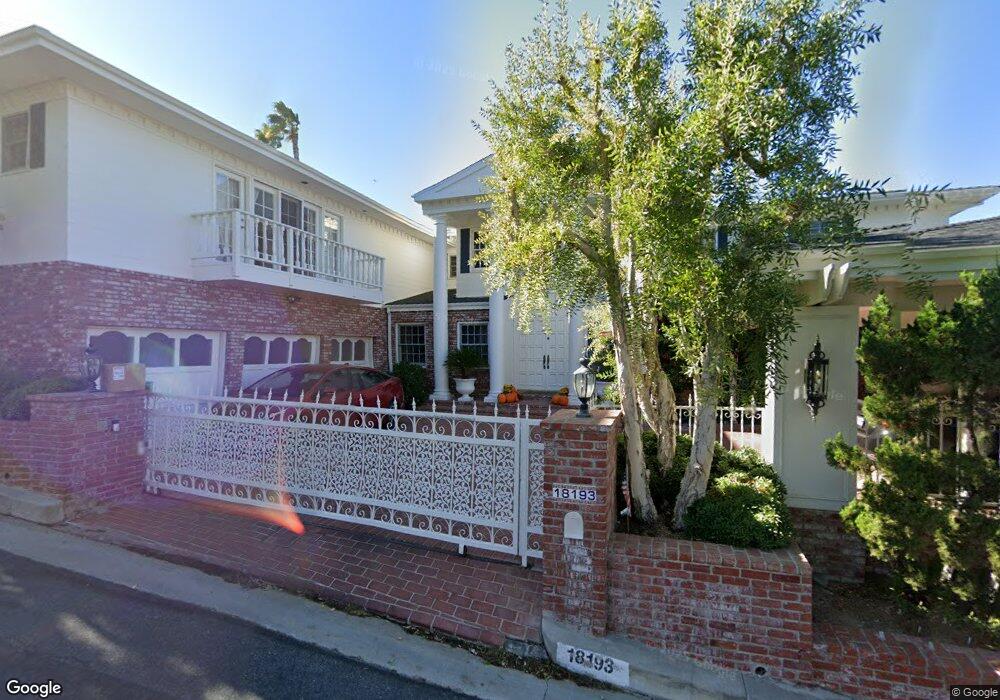
18193 Karen Dr Tarzana, CA 91356
Estimated Value: $2,765,000 - $3,328,000
6
Beds
5
Baths
6,000
Sq Ft
$512/Sq Ft
Est. Value
About This Home
This home is located at 18193 Karen Dr, Tarzana, CA 91356 and is currently estimated at $3,071,136, approximately $511 per square foot. 18193 Karen Dr is a home located in Los Angeles County with nearby schools including Gaspar De Portola Middle School, Nestle Avenue Charter, and Wilbur Charter For Enriched Academics.
Ownership History
Date
Name
Owned For
Owner Type
Purchase Details
Closed on
Jul 30, 2020
Sold by
Tomlin Gary
Bought by
Tomlin Gary and Tang Christopher C
Current Estimated Value
Purchase Details
Closed on
Nov 5, 1999
Sold by
Niesner Family Trust Niesner Frank And Elisab
Bought by
Tomlin Gary
Home Financials for this Owner
Home Financials are based on the most recent Mortgage that was taken out on this home.
Original Mortgage
$622,500
Outstanding Balance
$173,667
Interest Rate
6.62%
Estimated Equity
$2,897,469
Purchase Details
Closed on
Feb 28, 1998
Sold by
Niesner Frank and Niesner Elisabeth
Bought by
Niesner Frank and Niesner Elisabeth Marie
Purchase Details
Closed on
Mar 16, 1995
Sold by
Niesner Frank and Niesner Elisabeth
Bought by
Niesner Frank and Niesner Elisabeth
Home Financials for this Owner
Home Financials are based on the most recent Mortgage that was taken out on this home.
Original Mortgage
$250,000
Interest Rate
9.03%
Create a Home Valuation Report for This Property
The Home Valuation Report is an in-depth analysis detailing your home's value as well as a comparison with similar homes in the area
Home Values in the Area
Average Home Value in this Area
Purchase History
| Date | Buyer | Sale Price | Title Company |
|---|---|---|---|
| Tomlin Gary | -- | Accommodation | |
| Tomlin Gary | $1,175,000 | Lawyers Title Company | |
| Niesner Frank | -- | Southland Title | |
| Niesner Frank | -- | -- |
Source: Public Records
Mortgage History
| Date | Status | Borrower | Loan Amount |
|---|---|---|---|
| Open | Tomlin Gary | $622,500 | |
| Previous Owner | Niesner Frank | $250,000 | |
| Closed | Tomlin Gary | $222,500 |
Source: Public Records
Tax History Compared to Growth
Tax History
| Year | Tax Paid | Tax Assessment Tax Assessment Total Assessment is a certain percentage of the fair market value that is determined by local assessors to be the total taxable value of land and additions on the property. | Land | Improvement |
|---|---|---|---|---|
| 2025 | $22,171 | $1,805,940 | $885,756 | $920,184 |
| 2024 | $22,171 | $1,770,531 | $868,389 | $902,142 |
| 2023 | $21,750 | $1,735,815 | $851,362 | $884,453 |
| 2022 | $20,774 | $1,701,780 | $834,669 | $867,111 |
| 2021 | $20,506 | $1,668,412 | $818,303 | $850,109 |
| 2019 | $19,903 | $1,618,929 | $794,033 | $824,896 |
| 2018 | $19,536 | $1,587,186 | $778,464 | $808,722 |
| 2016 | $18,636 | $1,525,555 | $748,236 | $777,319 |
| 2015 | $18,366 | $1,502,640 | $736,997 | $765,643 |
| 2014 | $18,429 | $1,473,207 | $722,561 | $750,646 |
Source: Public Records
Map
Nearby Homes
- 4700 Dunas Ln
- 4551 Lindley Ave
- 4571 Gable Dr
- 18234 Sugarman St
- 18310 Karen Dr
- 18033 Rosita St
- 18057 Valley Vista Blvd
- 18016 Valley Vista Blvd
- 4965 Avenida Oriente
- 4817 Hermano Dr
- 4501 Grimes Place
- 17962 Valley Vista Blvd
- 4860 Enfield Ave
- 18623 Palomino Dr
- 5048 Hesperia Ave
- 5004 Enfield Ave
- 5052 Newcastle Ave
- 4406 Medley Place
- 5120 Etiwanda Ave
- 5132 Lindley Ave