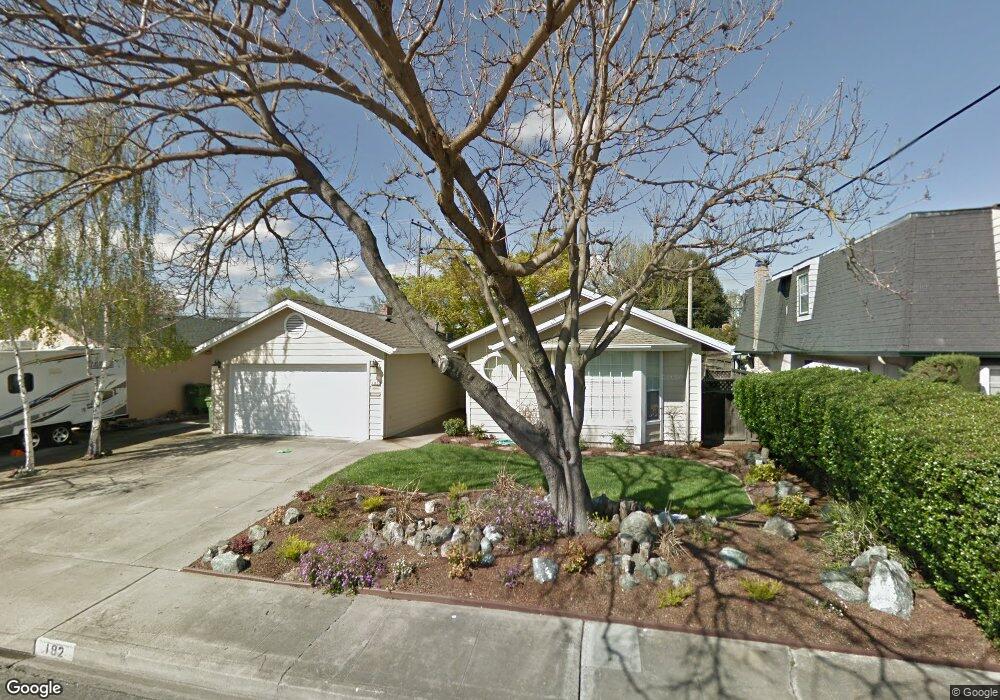
182 Brian Ln Santa Clara, CA 95051
Pruneridge NeighborhoodEstimated Value: $2,396,724 - $2,851,000
4
Beds
2
Baths
1,136
Sq Ft
$2,257/Sq Ft
Est. Value
About This Home
This home is located at 182 Brian Ln, Santa Clara, CA 95051 and is currently estimated at $2,564,431, approximately $2,257 per square foot. 182 Brian Ln is a home located in Santa Clara County with nearby schools including Dwight D. Eisenhower Elementary School, Warren E. Hyde Middle School, and Cupertino High School.
Ownership History
Date
Name
Owned For
Owner Type
Purchase Details
Closed on
May 11, 2021
Sold by
Yang Haini and Sun Wei
Bought by
Sun Wei and Yang Haini
Current Estimated Value
Home Financials for this Owner
Home Financials are based on the most recent Mortgage that was taken out on this home.
Original Mortgage
$417,000
Outstanding Balance
$377,102
Interest Rate
3.1%
Mortgage Type
New Conventional
Estimated Equity
$2,187,329
Purchase Details
Closed on
May 7, 2017
Sold by
Sun Wei and Yang Haini
Bought by
Sun Wei and Yang Haini
Purchase Details
Closed on
Mar 10, 2014
Sold by
Paxton Jeanette G and Overstreet Richard E
Bought by
Sun Wei and Yang Haini
Home Financials for this Owner
Home Financials are based on the most recent Mortgage that was taken out on this home.
Original Mortgage
$964,000
Outstanding Balance
$681,804
Interest Rate
2.75%
Mortgage Type
Adjustable Rate Mortgage/ARM
Estimated Equity
$1,882,627
Purchase Details
Closed on
Nov 22, 2004
Sold by
Overstreet Richard Edwin and Overstreet Delores M
Bought by
Overstreet Richard E and Overstreet Delores M
Create a Home Valuation Report for This Property
The Home Valuation Report is an in-depth analysis detailing your home's value as well as a comparison with similar homes in the area
Home Values in the Area
Average Home Value in this Area
Purchase History
| Date | Buyer | Sale Price | Title Company |
|---|---|---|---|
| Sun Wei | -- | Chicago Title Company | |
| Yang Haini | -- | Chicago Title Company | |
| Sun Wei | -- | None Available | |
| Sun Wei | $1,225,000 | First American Title Company | |
| Overstreet Richard E | -- | -- |
Source: Public Records
Mortgage History
| Date | Status | Borrower | Loan Amount |
|---|---|---|---|
| Open | Yang Haini | $417,000 | |
| Open | Sun Wei | $964,000 |
Source: Public Records
Tax History
| Year | Tax Paid | Tax Assessment Tax Assessment Total Assessment is a certain percentage of the fair market value that is determined by local assessors to be the total taxable value of land and additions on the property. | Land | Improvement |
|---|---|---|---|---|
| 2025 | $17,109 | $1,501,672 | $1,011,334 | $490,338 |
| 2024 | $17,109 | $1,472,228 | $991,504 | $480,724 |
| 2023 | $16,982 | $1,443,362 | $972,063 | $471,299 |
| 2022 | $16,876 | $1,415,061 | $953,003 | $462,058 |
| 2021 | $16,716 | $1,387,316 | $934,317 | $452,999 |
| 2020 | $16,526 | $1,373,092 | $924,737 | $448,355 |
| 2019 | $16,159 | $1,346,169 | $906,605 | $439,564 |
| 2018 | $15,783 | $1,319,775 | $888,829 | $430,946 |
| 2017 | $15,721 | $1,293,898 | $871,401 | $422,497 |
| 2016 | $15,240 | $1,268,528 | $854,315 | $414,213 |
| 2015 | $15,153 | $1,249,475 | $841,483 | $407,992 |
| 2014 | $1,547 | $1,100,000 | $720,000 | $380,000 |
Source: Public Records
Map
Nearby Homes
- 3041 Pruneridge Ave
- 4802 Rio Vista Ave
- 4826 Rio Vista Ave
- 534 Flannery St
- 4650 Corrida Cir
- 587 Cambridge Dr
- 328 Greendale Way
- 2831 Malabar Ave
- 638 Woodhams Rd
- 4774 Rio Rita Way
- 410 Auburn Way Unit 42
- 410 Auburn Way Unit 19
- 4405 Norwalk Dr Unit 1
- 494 Greendale Way
- 4425 Norwalk Dr Unit 29
- 4415 Norwalk Dr Unit 3
- 5011 Lapa Dr
- 5047 Lapa Dr
- 151 Kiely Blvd
- 544 Crimsonberry Way
- 172 Brian Ln
- 3174 Mauricia Ave
- 187 Cronin Dr
- 162 Brian Ln
- 3194 Mauricia Ave
- 181 Brian Ln
- 171 Brian Ln
- 3154 Mauricia Ave
- 167 Cronin Dr
- 152 Brian Ln
- 161 Brian Ln
- 157 Cronin Dr
- 3185 Mauricia Ave
- 3175 Mauricia Ave
- 3195 Mauricia Ave
- 3165 Mauricia Ave
- 151 Brian Ln
- 146 Brian Ln
- 180 Gilbert Ave
- 3155 Mauricia Ave
Your Personal Tour Guide
Ask me questions while you tour the home.