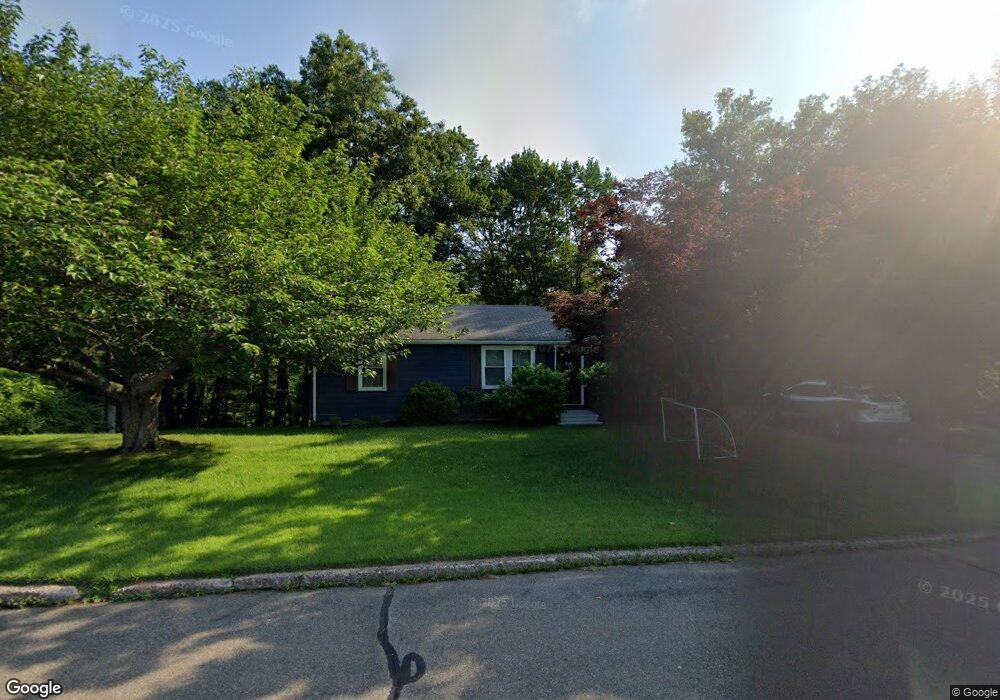
182 Byron Rd Meriden, CT 06451
Estimated Value: $249,000 - $381,000
3
Beds
2
Baths
1,104
Sq Ft
$301/Sq Ft
Est. Value
About This Home
This home is located at 182 Byron Rd, Meriden, CT 06451 and is currently estimated at $332,443, approximately $301 per square foot. 182 Byron Rd is a home located in New Haven County with nearby schools including Hanover School, Lincoln Middle School, and Orville H. Platt High School.
Ownership History
Date
Name
Owned For
Owner Type
Purchase Details
Closed on
May 14, 2009
Sold by
Department Of Housing & Urban Dev
Bought by
Mcdonald Ryan
Current Estimated Value
Home Financials for this Owner
Home Financials are based on the most recent Mortgage that was taken out on this home.
Original Mortgage
$127,525
Interest Rate
4.85%
Purchase Details
Closed on
Sep 19, 2008
Sold by
Gorlik Randy F
Bought by
Countrywide Home Loans
Purchase Details
Closed on
May 27, 1998
Sold by
Doolittle Peter J and Doolittle Karen A
Bought by
Gorlick Randy F and Gorlick Lidia
Create a Home Valuation Report for This Property
The Home Valuation Report is an in-depth analysis detailing your home's value as well as a comparison with similar homes in the area
Home Values in the Area
Average Home Value in this Area
Purchase History
| Date | Buyer | Sale Price | Title Company |
|---|---|---|---|
| Mcdonald Ryan | $120,000 | -- | |
| Countrywide Home Loans | -- | -- | |
| Gorlick Randy F | $107,800 | -- |
Source: Public Records
Mortgage History
| Date | Status | Borrower | Loan Amount |
|---|---|---|---|
| Open | Gorlick Randy F | $123,254 | |
| Closed | Gorlick Randy F | $127,525 | |
| Previous Owner | Gorlick Randy F | $30,000 |
Source: Public Records
Tax History Compared to Growth
Tax History
| Year | Tax Paid | Tax Assessment Tax Assessment Total Assessment is a certain percentage of the fair market value that is determined by local assessors to be the total taxable value of land and additions on the property. | Land | Improvement |
|---|---|---|---|---|
| 2025 | $6,279 | $156,590 | $72,100 | $84,490 |
| 2024 | $5,686 | $156,590 | $72,100 | $84,490 |
| 2023 | $5,448 | $156,590 | $72,100 | $84,490 |
| 2022 | $5,166 | $156,590 | $72,100 | $84,490 |
| 2021 | $4,539 | $111,090 | $56,980 | $54,110 |
| 2020 | $4,539 | $111,090 | $56,980 | $54,110 |
| 2019 | $4,539 | $111,090 | $56,980 | $54,110 |
| 2018 | $4,559 | $111,090 | $56,980 | $54,110 |
| 2017 | $4,435 | $111,090 | $56,980 | $54,110 |
| 2016 | $4,156 | $113,470 | $48,720 | $64,750 |
| 2015 | $4,156 | $113,470 | $48,720 | $64,750 |
| 2014 | $4,055 | $113,470 | $48,720 | $64,750 |
Source: Public Records
Map
Nearby Homes
- 11 Riverside Dr
- 274 Riverside Dr
- 0 River Rd
- 36 Red Fox Ln
- 661 Allen Ave
- 21 Schooner Ln
- 22 Spice Hill Dr
- 1278 Cheshire St
- 125 Dana Ln
- 145 Deer Run Rd
- 80 Sunrise Hill
- 66 Dana Ln
- 107 Schooner Ln
- 73 Sunrise Hill
- 1 Village View Terrace Unit 1
- 194 Debbie Dr
- 31 Lynn Dr
- 25 Suzy Ct
- 44 Douglas Dr
- 171 Oregon Rd