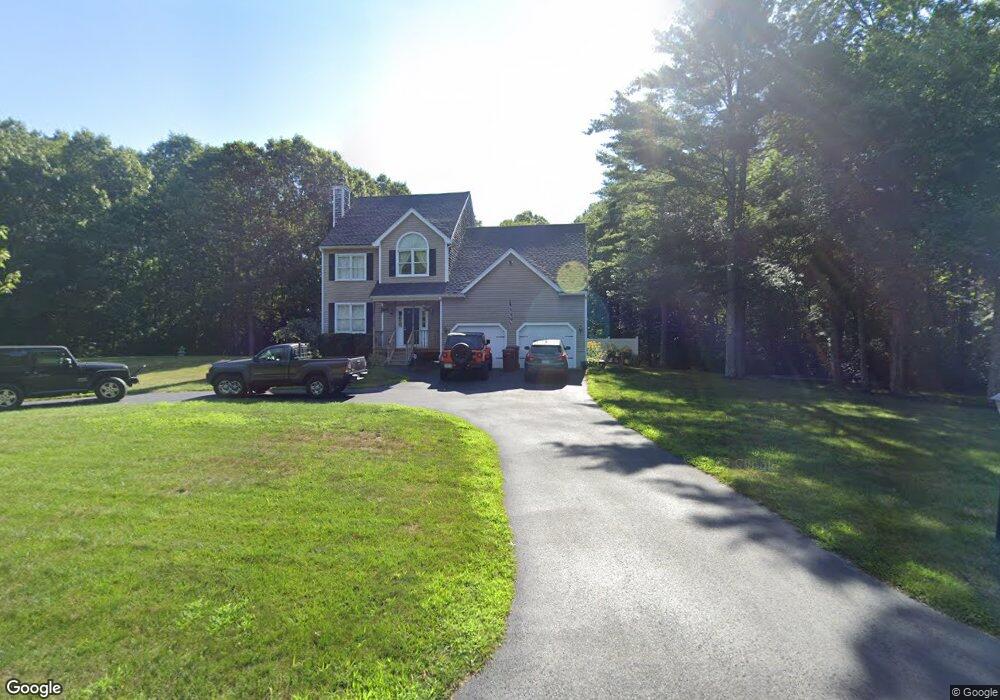
182 Colby Dr Middleboro, MA 02346
Estimated Value: $659,000 - $785,000
3
Beds
3
Baths
2,688
Sq Ft
$268/Sq Ft
Est. Value
About This Home
This home is located at 182 Colby Dr, Middleboro, MA 02346 and is currently estimated at $720,928, approximately $268 per square foot. 182 Colby Dr is a home located in Plymouth County with nearby schools including Mary K. Goode Elementary School.
Ownership History
Date
Name
Owned For
Owner Type
Purchase Details
Closed on
May 25, 2022
Sold by
Drew Jeffrey L and Drew Maura A
Bought by
M J L
Current Estimated Value
Purchase Details
Closed on
Feb 7, 1997
Sold by
Mehutchett Rt and Whitworth Edwin A
Bought by
Drew Jeffery L and Drew Marua A
Create a Home Valuation Report for This Property
The Home Valuation Report is an in-depth analysis detailing your home's value as well as a comparison with similar homes in the area
Home Values in the Area
Average Home Value in this Area
Purchase History
| Date | Buyer | Sale Price | Title Company |
|---|---|---|---|
| M J L | -- | None Available | |
| Drew Jeffery L | $179,900 | -- |
Source: Public Records
Mortgage History
| Date | Status | Borrower | Loan Amount |
|---|---|---|---|
| Previous Owner | Drew Jeffery L | $50,000 | |
| Previous Owner | Drew Jeffery L | $217,000 | |
| Previous Owner | Drew Jeffery L | $162,500 | |
| Previous Owner | Drew Jeffery L | $163,910 |
Source: Public Records
Tax History Compared to Growth
Tax History
| Year | Tax Paid | Tax Assessment Tax Assessment Total Assessment is a certain percentage of the fair market value that is determined by local assessors to be the total taxable value of land and additions on the property. | Land | Improvement |
|---|---|---|---|---|
| 2025 | $7,868 | $586,700 | $181,200 | $405,500 |
| 2024 | $7,829 | $578,200 | $172,800 | $405,400 |
| 2023 | $7,147 | $501,900 | $172,800 | $329,100 |
| 2022 | $6,630 | $431,100 | $150,100 | $281,000 |
| 2021 | $6,632 | $407,600 | $137,900 | $269,700 |
| 2020 | $6,516 | $410,300 | $137,900 | $272,400 |
| 2019 | $6,351 | $410,300 | $137,900 | $272,400 |
| 2018 | $5,772 | $370,000 | $125,400 | $244,600 |
| 2017 | $5,363 | $340,100 | $120,600 | $219,500 |
| 2016 | $5,193 | $326,200 | $114,000 | $212,200 |
| 2015 | $4,979 | $315,500 | $114,000 | $201,500 |
Source: Public Records
Map
Nearby Homes
- 563 County Rd
- 2230 Cranberry Hwy Unit 1
- 663 Wareham St Unit 8
- 663 Wareham St Unit 6
- 2 Cranberry Cir
- 47 Weaver St
- 11 Acoaxet Ln
- 9 Everett St
- 72 Papermill Rd Unit 72
- 103 Castle Dr
- 51 Crest Dr
- 20 Gault Rd
- 27 Siesta Dr
- 7 Forbes Rd
- 41 Longboat Rd
- 11 Fonseca Way
- 490 High St
- 5 Marks Way
- 571 Wareham St
- 3 Rochester Rd