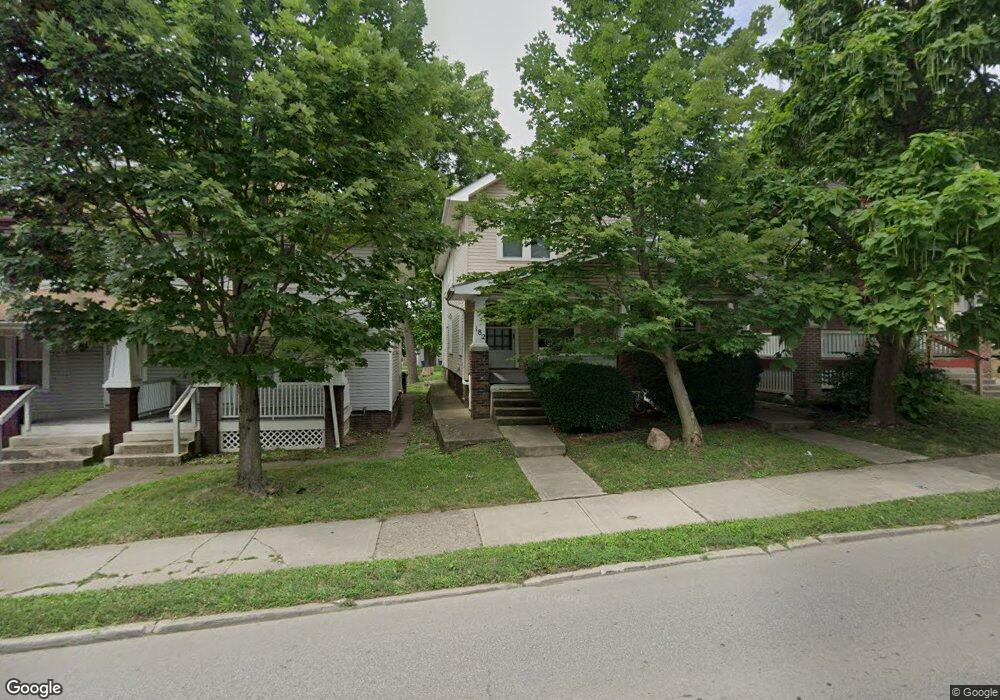
182 E Hudson St Unit 184 Columbus, OH 43202
Old North Columbus NeighborhoodEstimated Value: $369,000 - $445,884
6
Beds
2
Baths
2,484
Sq Ft
$166/Sq Ft
Est. Value
About This Home
This home is located at 182 E Hudson St Unit 184, Columbus, OH 43202 and is currently estimated at $412,471, approximately $166 per square foot. 182 E Hudson St Unit 184 is a home located in Franklin County with nearby schools including Clinton Elementary School, Dominion Middle School, and Whetstone High School.
Ownership History
Date
Name
Owned For
Owner Type
Purchase Details
Closed on
Feb 6, 2023
Sold by
Pavich Nicolas
Bought by
Pavich Properties Ltd
Current Estimated Value
Purchase Details
Closed on
Nov 18, 2004
Sold by
Pavich Nicolas and Pavich Amy H
Bought by
Pavich Nicolas and Pavich Milan
Home Financials for this Owner
Home Financials are based on the most recent Mortgage that was taken out on this home.
Original Mortgage
$78,500
Interest Rate
5.82%
Mortgage Type
New Conventional
Purchase Details
Closed on
Jul 23, 1998
Sold by
Harris William A and Harris Scott A
Bought by
Pavich Nicolas
Home Financials for this Owner
Home Financials are based on the most recent Mortgage that was taken out on this home.
Original Mortgage
$67,400
Interest Rate
7.03%
Purchase Details
Closed on
Feb 26, 1993
Purchase Details
Closed on
Dec 1, 1983
Create a Home Valuation Report for This Property
The Home Valuation Report is an in-depth analysis detailing your home's value as well as a comparison with similar homes in the area
Home Values in the Area
Average Home Value in this Area
Purchase History
| Date | Buyer | Sale Price | Title Company |
|---|---|---|---|
| Pavich Properties Ltd | -- | -- | |
| Pavich Nicolas | -- | Kendra Titl | |
| Pavich Nicolas | $74,900 | Chicago Title West | |
| -- | $57,000 | -- | |
| -- | -- | -- |
Source: Public Records
Mortgage History
| Date | Status | Borrower | Loan Amount |
|---|---|---|---|
| Previous Owner | Pavich Nicolas | $78,500 | |
| Previous Owner | Pavich Nicolas | $67,400 |
Source: Public Records
Tax History Compared to Growth
Tax History
| Year | Tax Paid | Tax Assessment Tax Assessment Total Assessment is a certain percentage of the fair market value that is determined by local assessors to be the total taxable value of land and additions on the property. | Land | Improvement |
|---|---|---|---|---|
| 2024 | $5,831 | $127,230 | $40,600 | $86,630 |
| 2023 | $5,758 | $127,230 | $40,600 | $86,630 |
| 2022 | $3,837 | $72,210 | $16,420 | $55,790 |
| 2021 | $3,844 | $72,210 | $16,420 | $55,790 |
| 2020 | $3,850 | $72,210 | $16,420 | $55,790 |
| 2019 | $3,454 | $55,550 | $12,640 | $42,910 |
| 2018 | $3,262 | $55,550 | $12,640 | $42,910 |
| 2017 | $3,453 | $55,550 | $12,640 | $42,910 |
| 2016 | $3,377 | $49,710 | $6,550 | $43,160 |
| 2015 | $3,075 | $49,710 | $6,550 | $43,160 |
| 2014 | $3,082 | $49,710 | $6,550 | $43,160 |
| 2013 | $1,447 | $47,320 | $6,230 | $41,090 |
Source: Public Records
Map
Nearby Homes
- 2537 Medary Ave Unit 539
- 109-117 E Arcadia Ave
- 204 E Blake Ave Unit 206
- 363 E Hudson St Unit 365
- 2399 Indianola Ave
- 6 E Blake Ave
- 241 E Blake Ave
- 415 Glen Echo Cir
- 2362 Indiana Ave
- 305 E Kelso Rd
- 2350 Indiana Ave
- 2683 Neil Ave Unit 685
- 2804 Indianola Ave
- 2394 Neil Ave
- 217 E Oakland Ave
- 203 E Tulane Rd
- 2828 Kensington Place W
- 410 Wyandotte Ave
- 2295 N 4th St
- 9 E Norwich Ave Unit 15
- 182-184 E Hudson St
- 186 E Hudson St
- 172-174 E Hudson St
- 172 E Hudson St Unit 174
- 194 E Hudson St Unit 196
- 198 E Hudson St Unit 200
- 198-200 E Hudson St
- 202 E Hudson St Unit 204
- 177-179 E Hudson St
- 177-179 E Hudson St Unit 179
- 171-173 E Hudson St
- 177 E Hudson St Unit 179
- 171 E Hudson St Unit 173
- 171 E Hudson St Unit 171 and 173
- 173 E Duncan St Unit 177 Duncan
- 173 E Duncan St Unit 75
- 183 E Duncan St
- 179 E Duncan St
- 206 E Hudson St Unit 208
- 177 E Duncan St