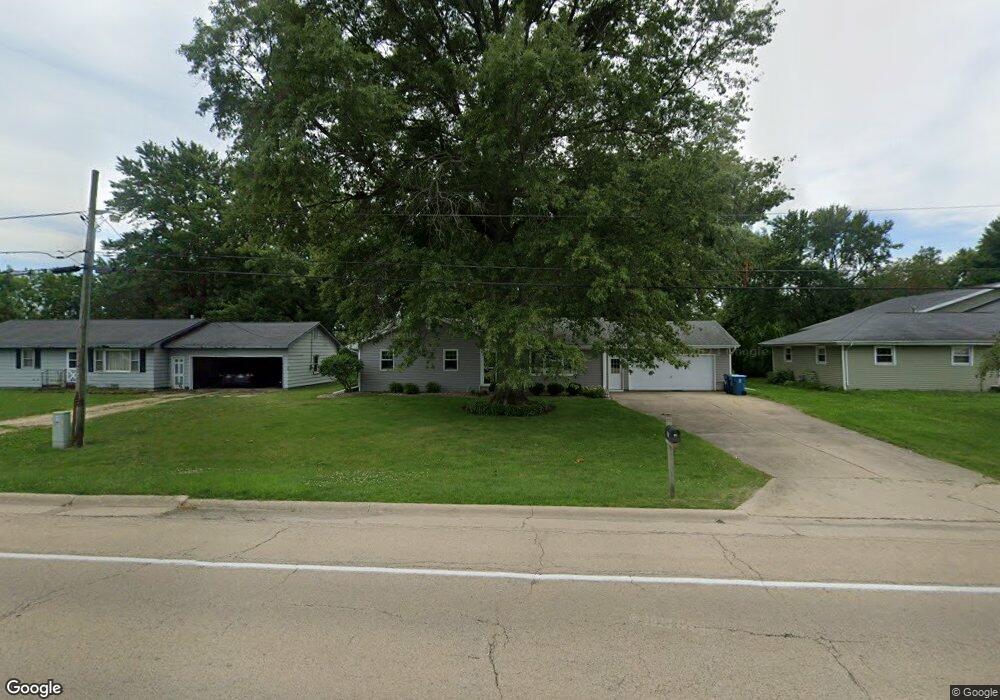
182 E Route 52 Mendota, IL 61342
Estimated Value: $177,000 - $231,000
3
Beds
2
Baths
1,440
Sq Ft
$138/Sq Ft
Est. Value
About This Home
This home is located at 182 E Route 52, Mendota, IL 61342 and is currently estimated at $198,168, approximately $137 per square foot. 182 E Route 52 is a home located in LaSalle County with nearby schools including Northbrook School, Blackstone Elementary School, and Lincoln Elementary School.
Ownership History
Date
Name
Owned For
Owner Type
Purchase Details
Closed on
Sep 26, 2023
Sold by
Jansen Cheryl L
Bought by
Odonnell Drake
Current Estimated Value
Home Financials for this Owner
Home Financials are based on the most recent Mortgage that was taken out on this home.
Original Mortgage
$150,000
Outstanding Balance
$146,246
Interest Rate
6.75%
Mortgage Type
New Conventional
Estimated Equity
$51,922
Purchase Details
Closed on
Apr 29, 2010
Sold by
Coulter Matthew G
Bought by
Leffelman Theodore and Bauer Emily
Home Financials for this Owner
Home Financials are based on the most recent Mortgage that was taken out on this home.
Original Mortgage
$104,400
Interest Rate
5.05%
Mortgage Type
New Conventional
Purchase Details
Closed on
May 7, 2009
Sold by
Wilson Deniel T and Wilson Amy E
Bought by
Coulter Matthew G
Home Financials for this Owner
Home Financials are based on the most recent Mortgage that was taken out on this home.
Original Mortgage
$104,000
Interest Rate
5.75%
Mortgage Type
Assumption
Create a Home Valuation Report for This Property
The Home Valuation Report is an in-depth analysis detailing your home's value as well as a comparison with similar homes in the area
Home Values in the Area
Average Home Value in this Area
Purchase History
| Date | Buyer | Sale Price | Title Company |
|---|---|---|---|
| Odonnell Drake | $188,000 | None Available | |
| Leffelman Theodore | $116,000 | None Available | |
| Coulter Matthew G | $115,000 | None Available |
Source: Public Records
Mortgage History
| Date | Status | Borrower | Loan Amount |
|---|---|---|---|
| Open | Odonnell Drake | $150,000 | |
| Previous Owner | Leffelman Theodore | $104,400 | |
| Previous Owner | Coulter Matthew G | $104,000 |
Source: Public Records
Tax History
| Year | Tax Paid | Tax Assessment Tax Assessment Total Assessment is a certain percentage of the fair market value that is determined by local assessors to be the total taxable value of land and additions on the property. | Land | Improvement |
|---|---|---|---|---|
| 2024 | $2,844 | $48,890 | $4,903 | $43,987 |
| 2023 | $2,359 | $45,530 | $4,566 | $40,964 |
| 2022 | $2,104 | $41,508 | $4,163 | $37,345 |
| 2021 | $1,982 | $39,292 | $3,941 | $35,351 |
| 2020 | $1,822 | $37,099 | $3,721 | $33,378 |
| 2019 | $1,929 | $37,099 | $3,721 | $33,378 |
| 2018 | $1,946 | $36,286 | $3,639 | $32,647 |
| 2017 | $1,986 | $35,827 | $3,593 | $32,234 |
| 2016 | $1,912 | $34,301 | $3,440 | $30,861 |
| 2015 | $929 | $29,907 | $3,336 | $26,571 |
| 2012 | -- | $34,254 | $3,820 | $30,434 |
Source: Public Records
Map
Nearby Homes
- 182 E Us Highway 52
- 182 E Rt 52
- 182 Rt 52
- 182 U S 52
- 184 E Il State Route 52
- 180 E Il St Rt 52
- 178 E Us Highway 52
- 186 E Us Highway 52
- 188 E Us Highway 52
- 176 E Us Highway 52
- 177 E Il State Route 52
- 190 E Us Highway 52
- 174 E Us Highway 52
- 192 U S 52
- 172 E Us Highway 52
- 172 E Us Highway 52
- 173 E Il State Route 52
- 170 E Us Highway 52
- 168 E Us Highway 52
- 2104 Main St
Your Personal Tour Guide
Ask me questions while you tour the home.