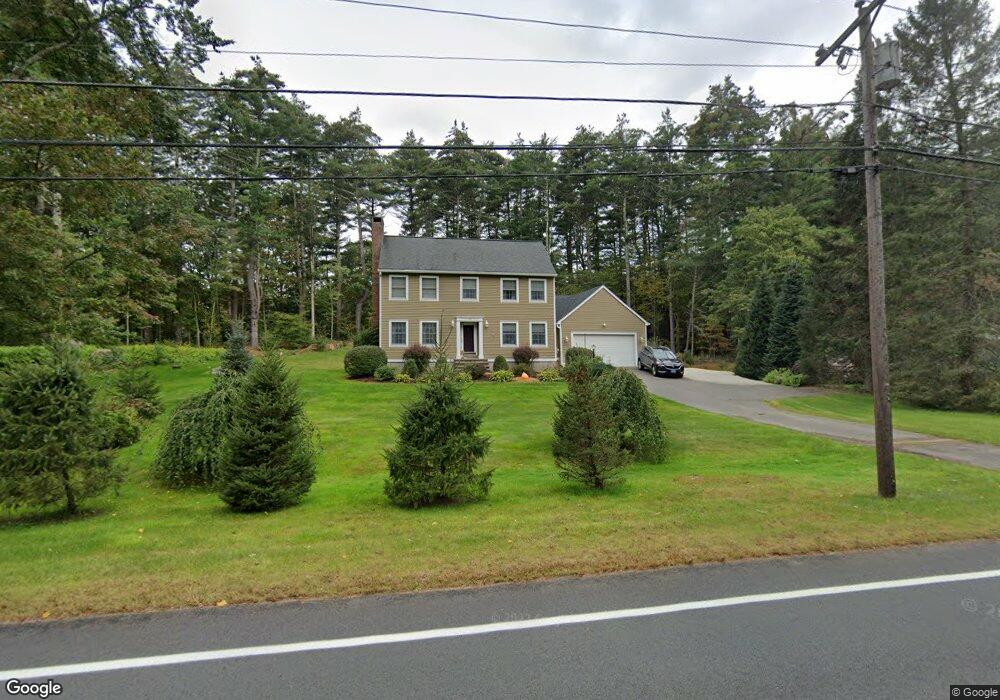
182 East St Stafford Springs, CT 06076
Stafford NeighborhoodEstimated Value: $540,000 - $588,458
4
Beds
3
Baths
3,128
Sq Ft
$179/Sq Ft
Est. Value
About This Home
This home is located at 182 East St, Stafford Springs, CT 06076 and is currently estimated at $559,865, approximately $178 per square foot. 182 East St is a home located in Tolland County with nearby schools including Stafford Elementary School, Stafford Middle School, and Stafford High School.
Ownership History
Date
Name
Owned For
Owner Type
Purchase Details
Closed on
Jun 1, 2009
Sold by
Mardente Vincent
Bought by
Mayer Jeffrey and Davis Amanda
Current Estimated Value
Home Financials for this Owner
Home Financials are based on the most recent Mortgage that was taken out on this home.
Original Mortgage
$250,000
Interest Rate
4.87%
Purchase Details
Closed on
Feb 1, 2000
Sold by
Jewson Mark
Bought by
Mardente Vincent and Mardente Michelle
Purchase Details
Closed on
Sep 30, 1997
Sold by
Wong Kwok Wah and Huang Yin Zhong
Bought by
Jewson Mark
Create a Home Valuation Report for This Property
The Home Valuation Report is an in-depth analysis detailing your home's value as well as a comparison with similar homes in the area
Home Values in the Area
Average Home Value in this Area
Purchase History
| Date | Buyer | Sale Price | Title Company |
|---|---|---|---|
| Mayer Jeffrey | $270,000 | -- | |
| Mardente Vincent | $178,500 | -- | |
| Jewson Mark | $178,000 | -- |
Source: Public Records
Mortgage History
| Date | Status | Borrower | Loan Amount |
|---|---|---|---|
| Closed | Jewson Mark | $20,000 | |
| Open | Jewson Mark | $220,000 | |
| Closed | Jewson Mark | $250,000 |
Source: Public Records
Tax History Compared to Growth
Tax History
| Year | Tax Paid | Tax Assessment Tax Assessment Total Assessment is a certain percentage of the fair market value that is determined by local assessors to be the total taxable value of land and additions on the property. | Land | Improvement |
|---|---|---|---|---|
| 2025 | $15,246 | $240,520 | $31,220 | $209,300 |
| 2024 | $9,282 | $240,520 | $31,220 | $209,300 |
| 2023 | $6,436 | $175,070 | $31,220 | $143,850 |
| 2022 | $6,264 | $175,070 | $31,220 | $143,850 |
| 2021 | $6,115 | $175,070 | $31,220 | $143,850 |
| 2020 | $5,900 | $168,910 | $34,650 | $134,260 |
| 2019 | $5,900 | $168,910 | $34,650 | $134,260 |
| 2018 | $5,787 | $168,910 | $34,650 | $134,260 |
| 2017 | $5,731 | $168,910 | $34,650 | $134,260 |
| 2016 | $5,660 | $168,910 | $34,650 | $134,260 |
| 2015 | $5,646 | $169,190 | $34,650 | $134,540 |
| 2014 | $5,588 | $169,190 | $34,650 | $134,540 |
Source: Public Records
Map
Nearby Homes