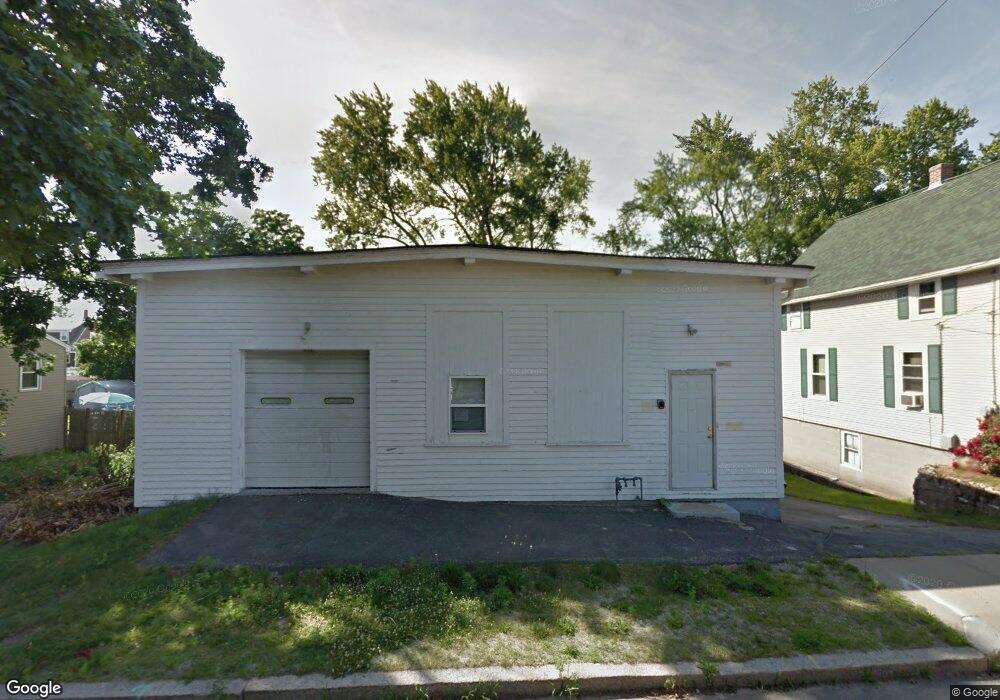
182 Farm St Unit 1A Woonsocket, RI 02895
North End Neighborhood
2
Beds
2
Baths
1,250
Sq Ft
9,583
Sq Ft Lot
About This Home
This home is located at 182 Farm St Unit 1A, Woonsocket, RI 02895. 182 Farm St Unit 1A is a home located in Providence County with nearby schools including Woonsocket High School, Rise Prep Mayoral Academy Middle School, and Rise Prep Mayoral Academy.
Ownership History
Date
Name
Owned For
Owner Type
Purchase Details
Closed on
Oct 13, 2020
Sold by
Sprague Thomas R
Bought by
Imagining Systems Inc
Purchase Details
Closed on
May 22, 2019
Sold by
Woonsocket City Of
Bought by
Sprague Thomas R
Purchase Details
Closed on
May 3, 2016
Sold by
East West Dev Llc
Bought by
Trooper Inc
Purchase Details
Closed on
Jul 24, 2007
Sold by
Duggan John G and Duggan Pamela A
Bought by
East West Development
Purchase Details
Closed on
Oct 20, 2003
Sold by
Llteureux Ernest J
Bought by
Duggan John G and Duggan Pamela A
Create a Home Valuation Report for This Property
The Home Valuation Report is an in-depth analysis detailing your home's value as well as a comparison with similar homes in the area
Home Values in the Area
Average Home Value in this Area
Purchase History
| Date | Buyer | Sale Price | Title Company |
|---|---|---|---|
| Imagining Systems Inc | -- | None Available | |
| Imagining Systems Inc | -- | None Available | |
| Imagining Systems Inc | -- | None Available | |
| Sprague Thomas R | $14,715 | -- | |
| Sprague Thomas R | $14,715 | -- | |
| Trooper Inc | $35,000 | -- | |
| Trooper Inc | $35,000 | -- | |
| East West Development | $110,000 | -- | |
| East West Development | $110,000 | -- | |
| Duggan John G | $95,000 | -- | |
| Duggan John G | $95,000 | -- |
Source: Public Records
Tax History
| Year | Tax Paid | Tax Assessment Tax Assessment Total Assessment is a certain percentage of the fair market value that is determined by local assessors to be the total taxable value of land and additions on the property. | Land | Improvement |
|---|---|---|---|---|
| 2025 | $3,295 | $154,700 | $51,100 | $103,600 |
| 2024 | $3,658 | $135,600 | $42,200 | $93,400 |
| 2023 | $3,517 | $135,600 | $42,200 | $93,400 |
| 2022 | $3,517 | $135,600 | $42,200 | $93,400 |
| 2021 | $2,513 | $105,800 | $31,900 | $73,900 |
| 2020 | $2,539 | $105,800 | $31,900 | $73,900 |
| 2018 | $0 | $105,800 | $31,900 | $73,900 |
| 2017 | $3,826 | $103,600 | $36,900 | $66,700 |
| 2016 | $3,972 | $103,600 | $36,900 | $66,700 |
| 2015 | $4,217 | $103,600 | $36,900 | $66,700 |
| 2014 | $4,275 | $106,900 | $40,900 | $66,000 |
Source: Public Records
Map
Nearby Homes
- 589 Gaskill St
- 458 Prospect St
- 542 Prospect St
- 83 Summer St
- 154 156 Winter St
- 130 E School St
- 56 Winter St
- 60 Fairlawn Ave
- 58 Oakley Rd
- 308 Harris Ave
- 10 Huntington Ave
- 256 Privilege St
- 0 N Main St Unit 1401765
- 11 Federal St
- 44 Federal St
- 115 Railroad St
- 40 Valley St
- 42 Elbow St
- 60 Rathbun St
- 36 Fairmount St
Your Personal Tour Guide
Ask me questions while you tour the home.