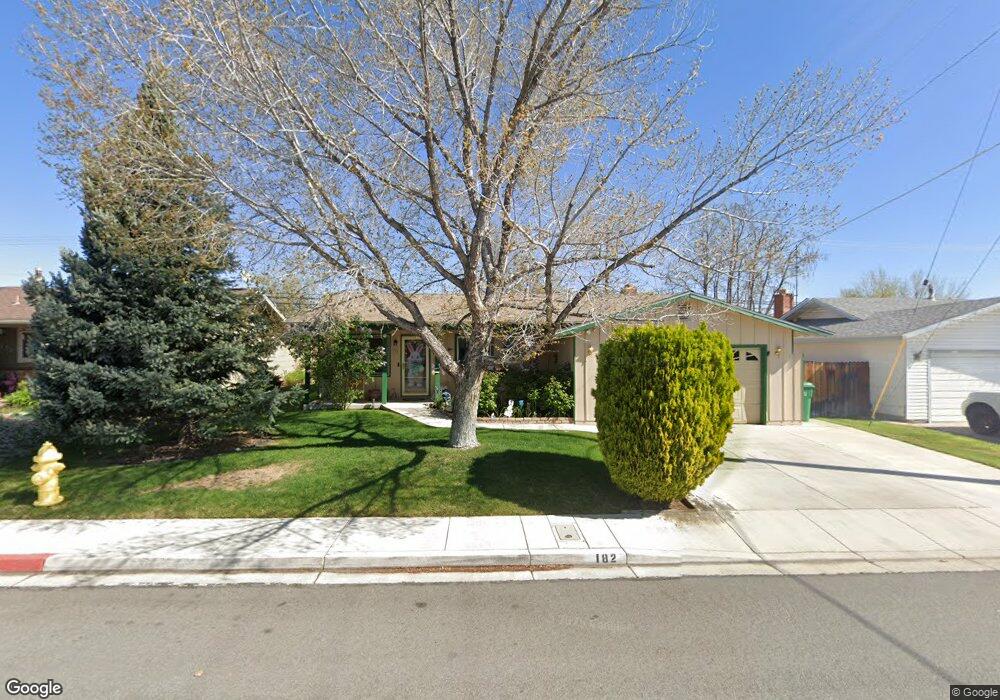
182 Gault Way Sparks, NV 89431
McCarran Boulevard-Probasco NeighborhoodEstimated Value: $423,000 - $466,000
3
Beds
2
Baths
1,492
Sq Ft
$297/Sq Ft
Est. Value
About This Home
This home is located at 182 Gault Way, Sparks, NV 89431 and is currently estimated at $443,133, approximately $297 per square foot. 182 Gault Way is a home located in Washoe County with nearby schools including Florence Drake Elementary School, George L Dilworth Middle School, and Sparks High School.
Ownership History
Date
Name
Owned For
Owner Type
Purchase Details
Closed on
Jan 14, 2011
Sold by
Morgan William H and Morgan Donna R
Bought by
Morgan William Henry and Morgan Donna Rae
Current Estimated Value
Purchase Details
Closed on
Aug 16, 2010
Sold by
Nres Nv1 Llc
Bought by
Morgan William H and Morgan Donna R
Home Financials for this Owner
Home Financials are based on the most recent Mortgage that was taken out on this home.
Original Mortgage
$102,400
Outstanding Balance
$67,593
Interest Rate
4.51%
Mortgage Type
New Conventional
Estimated Equity
$375,540
Purchase Details
Closed on
Feb 8, 2010
Sold by
Ibarra Gerardo and Ibarra Isabel
Bought by
Nres Nv1 Llc
Purchase Details
Closed on
Oct 6, 1995
Sold by
Taft Ray A and Taft Renee
Bought by
Ibarra Gerardo and Ibarra Maria Isabel
Home Financials for this Owner
Home Financials are based on the most recent Mortgage that was taken out on this home.
Original Mortgage
$112,100
Interest Rate
7.92%
Create a Home Valuation Report for This Property
The Home Valuation Report is an in-depth analysis detailing your home's value as well as a comparison with similar homes in the area
Home Values in the Area
Average Home Value in this Area
Purchase History
| Date | Buyer | Sale Price | Title Company |
|---|---|---|---|
| Morgan William Henry | -- | None Available | |
| Morgan William H | $128,000 | Western Title Company | |
| Nres Nv1 Llc | $82,129 | Accommodation | |
| Ibarra Gerardo | $118,000 | First Centennial Title Co |
Source: Public Records
Mortgage History
| Date | Status | Borrower | Loan Amount |
|---|---|---|---|
| Open | Morgan William H | $102,400 | |
| Previous Owner | Ibarra Gerardo | $112,100 |
Source: Public Records
Tax History Compared to Growth
Tax History
| Year | Tax Paid | Tax Assessment Tax Assessment Total Assessment is a certain percentage of the fair market value that is determined by local assessors to be the total taxable value of land and additions on the property. | Land | Improvement |
|---|---|---|---|---|
| 2025 | $968 | $51,235 | $30,209 | $21,027 |
| 2024 | $968 | $47,763 | $27,059 | $20,705 |
| 2023 | $939 | $47,369 | $28,193 | $19,177 |
| 2022 | $911 | $39,186 | $23,562 | $15,624 |
| 2021 | $886 | $31,373 | $16,160 | $15,213 |
| 2020 | $858 | $30,172 | $15,246 | $14,926 |
| 2019 | $833 | $28,430 | $14,301 | $14,129 |
| 2018 | $812 | $24,095 | $10,553 | $13,542 |
| 2017 | $787 | $23,395 | $9,356 | $14,039 |
| 2016 | $768 | $23,206 | $8,411 | $14,795 |
| 2015 | $765 | $22,178 | $6,930 | $15,248 |
| 2014 | $743 | $21,188 | $5,796 | $15,392 |
| 2013 | -- | $19,720 | $4,057 | $15,663 |
Source: Public Records
Map
Nearby Homes
- 119 Devere Way
- 465 Lenwood Dr
- 10 Sheridan Way
- 3245 Elaine Way
- 120 E Lenwood Dr
- 780 Emerson Way
- 2865 Patrice Dr
- 3465 Dawn Cir
- 1940 4th St Unit 20
- 1940 4th St Unit 51
- 3071 Meadowlands Dr
- 1945 4th St Unit 32
- 1945 4th St Unit 33
- 1945 4th St Unit 10
- 3545 4th St
- 1703 1st St
- 3104 Sandy St
- 8 E O St
- 3595 Rocky Ridge Ct
- 3607 Keogh Dr