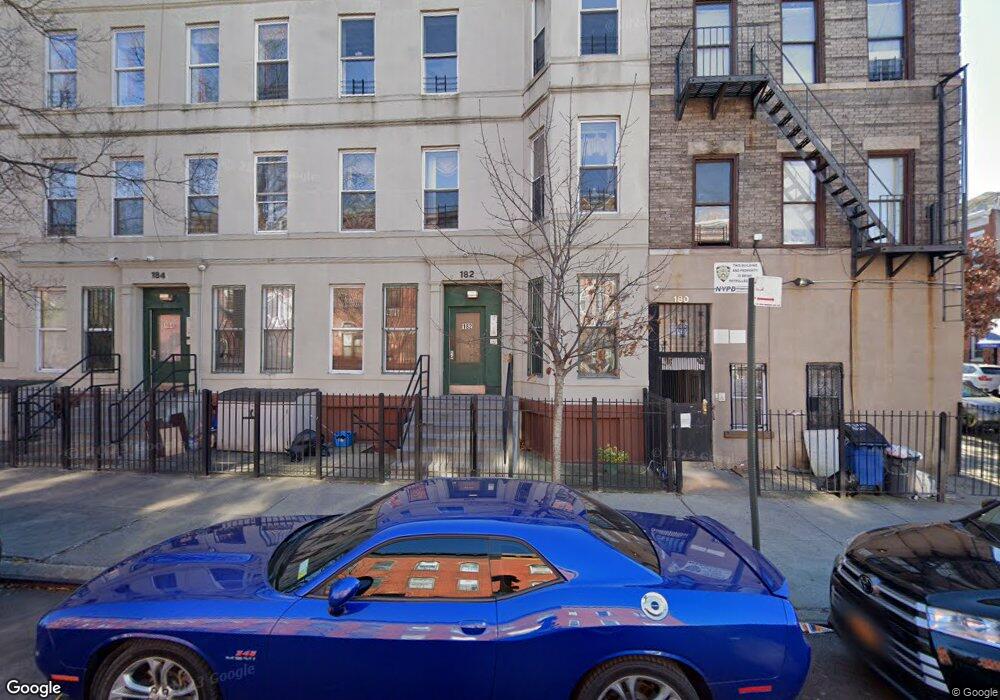
182 Hull St Unit 182D Brooklyn, NY 11233
Ocean Hill NeighborhoodEstimated Value: $485,000 - $617,000
Studio
--
Bath
948
Sq Ft
$566/Sq Ft
Est. Value
About This Home
This home is located at 182 Hull St Unit 182D, Brooklyn, NY 11233 and is currently estimated at $537,000, approximately $566 per square foot. 182 Hull St Unit 182D is a home located in Kings County with nearby schools including P.S. Is 155 Nicholas Herkimer, P.S./I.S. 137 Rachel Jean Mitchell, and P.S. 178 Saint Clair Mckelway.
Ownership History
Date
Name
Owned For
Owner Type
Purchase Details
Closed on
Oct 10, 2016
Sold by
Cort Seon M
Bought by
Chen Jessica and Cort Seon M
Current Estimated Value
Home Financials for this Owner
Home Financials are based on the most recent Mortgage that was taken out on this home.
Original Mortgage
$290,000
Outstanding Balance
$231,087
Interest Rate
3.44%
Mortgage Type
New Conventional
Estimated Equity
$305,913
Purchase Details
Closed on
Jun 24, 2009
Sold by
Fanniemae and International Plaza Ii
Bought by
Cort Seon M
Home Financials for this Owner
Home Financials are based on the most recent Mortgage that was taken out on this home.
Original Mortgage
$92,000
Interest Rate
5.31%
Mortgage Type
Purchase Money Mortgage
Purchase Details
Closed on
May 22, 2009
Sold by
Gmac Mortgage Corporation and Gmac Mortgage Llc
Bought by
Federal National Mortgage Association
Home Financials for this Owner
Home Financials are based on the most recent Mortgage that was taken out on this home.
Original Mortgage
$92,000
Interest Rate
5.31%
Mortgage Type
Purchase Money Mortgage
Create a Home Valuation Report for This Property
The Home Valuation Report is an in-depth analysis detailing your home's value as well as a comparison with similar homes in the area
Home Values in the Area
Average Home Value in this Area
Purchase History
| Date | Buyer | Sale Price | Title Company |
|---|---|---|---|
| Chen Jessica | -- | -- | |
| Chen Jessica | -- | -- | |
| Chen Jessica | -- | -- | |
| Cort Seon M | $115,000 | -- | |
| Cort Seon M | $115,000 | -- | |
| Federal National Mortgage Association | -- | -- | |
| Federal National Mortgage Association | -- | -- |
Source: Public Records
Mortgage History
| Date | Status | Borrower | Loan Amount |
|---|---|---|---|
| Open | Chen Jessica | $290,000 | |
| Closed | Chen Jessica | $290,000 | |
| Previous Owner | Cort Seon M | $92,000 |
Source: Public Records
Tax History
| Year | Tax Paid | Tax Assessment Tax Assessment Total Assessment is a certain percentage of the fair market value that is determined by local assessors to be the total taxable value of land and additions on the property. | Land | Improvement |
|---|---|---|---|---|
| 2025 | $1,743 | $31,296 | $9,731 | $21,565 |
| 2024 | $1,743 | $31,938 | $9,731 | $22,207 |
| 2023 | $1,220 | $35,027 | $9,731 | $25,296 |
| 2022 | $1,145 | $33,437 | $9,731 | $23,706 |
| 2021 | $1,027 | $31,976 | $9,731 | $22,245 |
| 2020 | $641 | $35,694 | $9,731 | $25,963 |
| 2019 | $694 | $36,515 | $9,731 | $26,784 |
| 2018 | $509 | $32,117 | $7,872 | $24,245 |
| 2017 | $366 | $29,040 | $4,795 | $24,245 |
| 2016 | $306 | $26,489 | $2,244 | $24,245 |
| 2015 | $236 | $25,271 | $2,244 | $23,027 |
| 2014 | $236 | $21,553 | $2,244 | $19,309 |
Source: Public Records
Map
Nearby Homes
- 210 Hull St Unit 210A
- 210 Hull St Unit A
- 148 Somers St
- 166A Hull St
- 284 Macdougal St
- 91 Somers St
- 70 Somers St
- 146A Hull St
- 2050 Eastern Pkwy
- 1350 Herkimer St
- 6 Pilling St
- 12 Pilling St
- 10 Monaco Place
- 90 Sackman St
- 2148 Fulton St
- 27 Sherlock Place
- 27 Monaco Place
- 1474 Bushwick Ave Unit 1R
- 64 De Sales Place
- 88 Granite St
- 182 Hull St Unit 182C
- 182 Hull St Unit 182B
- 182 Hull St Unit 182A
- 182 Hull St
- 210 Hull St Unit 210D
- 210 Hull St Unit 210C
- 210 Hull St Unit 210B
- 210 Hull St Unit B
- 208 Hull St Unit 208D
- 208 Hull St Unit 208C
- 208 Hull St Unit 208B
- 208 Hull St Unit 208A
- 208 Hull St Unit B
- 208 Hull St Unit A
- 204 Hull St Unit 204D
- 204 Hull St Unit 204C
- 204 Hull St Unit 204B
- 204 Hull St Unit 204A
- 204 Hull St Unit B
- 204 Hull St Unit D
Your Personal Tour Guide
Ask me questions while you tour the home.