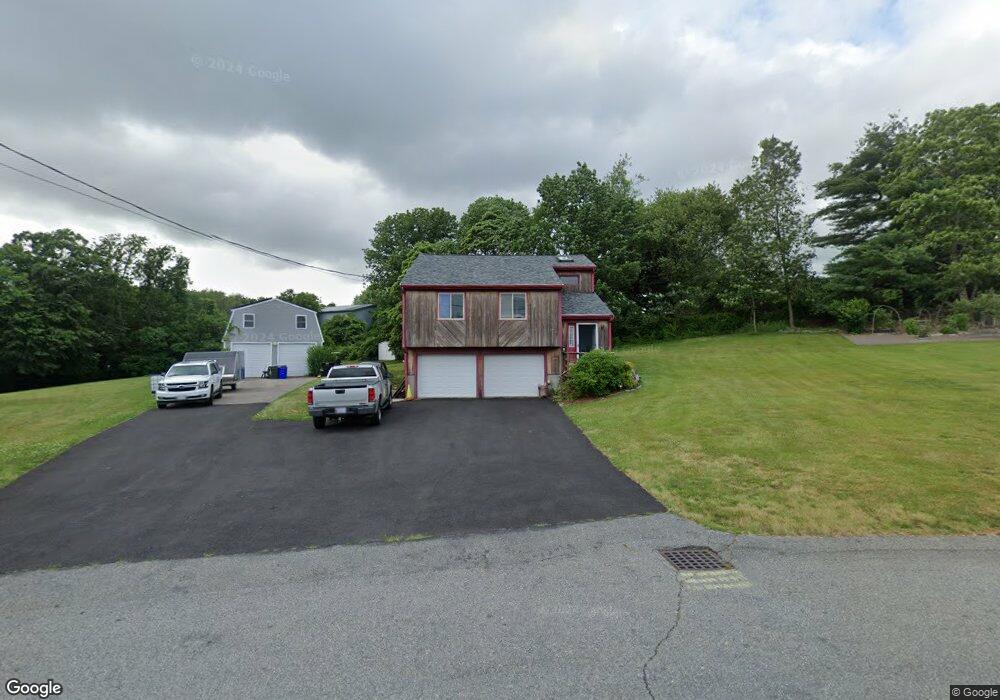
182 Joseph Dr Fall River, MA 02720
Highlands-Fall River NeighborhoodEstimated Value: $466,000 - $551,000
3
Beds
2
Baths
1,667
Sq Ft
$311/Sq Ft
Est. Value
About This Home
This home is located at 182 Joseph Dr, Fall River, MA 02720 and is currently estimated at $519,053, approximately $311 per square foot. 182 Joseph Dr is a home located in Bristol County with nearby schools including North End Elementary School, Morton Middle School, and B M C Durfee High School.
Ownership History
Date
Name
Owned For
Owner Type
Purchase Details
Closed on
Sep 11, 2007
Sold by
Perry Kathleen E and Perry Michael L
Bought by
Perry Michael L
Current Estimated Value
Home Financials for this Owner
Home Financials are based on the most recent Mortgage that was taken out on this home.
Original Mortgage
$149,000
Interest Rate
6.74%
Mortgage Type
Purchase Money Mortgage
Purchase Details
Closed on
Jun 25, 2007
Sold by
Perry Kathleen E and Perry Michael L
Bought by
Perry Kathleen E and Perry Michael L
Purchase Details
Closed on
Jan 22, 1988
Sold by
Deschene Bldg & Dev
Bought by
Perry Michael L
Home Financials for this Owner
Home Financials are based on the most recent Mortgage that was taken out on this home.
Original Mortgage
$55,000
Interest Rate
10.64%
Mortgage Type
Purchase Money Mortgage
Create a Home Valuation Report for This Property
The Home Valuation Report is an in-depth analysis detailing your home's value as well as a comparison with similar homes in the area
Home Values in the Area
Average Home Value in this Area
Purchase History
| Date | Buyer | Sale Price | Title Company |
|---|---|---|---|
| Perry Michael L | -- | -- | |
| Perry Kathleen E | -- | -- | |
| Perry Michael L | $144,900 | -- |
Source: Public Records
Mortgage History
| Date | Status | Borrower | Loan Amount |
|---|---|---|---|
| Open | Perry Michael L | $195,000 | |
| Closed | Perry Michael L | $149,000 | |
| Previous Owner | Perry Michael L | $50,000 | |
| Previous Owner | Perry Michael L | $9,000 | |
| Previous Owner | Perry Michael L | $55,000 |
Source: Public Records
Tax History
| Year | Tax Paid | Tax Assessment Tax Assessment Total Assessment is a certain percentage of the fair market value that is determined by local assessors to be the total taxable value of land and additions on the property. | Land | Improvement |
|---|---|---|---|---|
| 2025 | $4,873 | $425,600 | $165,700 | $259,900 |
| 2024 | $4,301 | $374,300 | $159,400 | $214,900 |
| 2023 | $4,364 | $355,700 | $137,800 | $217,900 |
| 2022 | $4,090 | $324,100 | $128,900 | $195,200 |
| 2021 | $4,712 | $340,700 | $129,300 | $211,400 |
| 2020 | $4,410 | $305,200 | $129,500 | $175,700 |
| 2019 | $4,387 | $300,900 | $131,600 | $169,300 |
| 2018 | $4,159 | $284,500 | $131,600 | $152,900 |
| 2017 | $3,805 | $271,800 | $120,700 | $151,100 |
| 2016 | $3,634 | $266,600 | $120,700 | $145,900 |
| 2015 | $3,703 | $283,100 | $120,700 | $162,400 |
| 2014 | $3,460 | $275,000 | $112,600 | $162,400 |
Source: Public Records
Map
Nearby Homes
- 2106 Meridian St
- 1170 Wilson Rd Unit 1
- 174 Columbus Dr
- Parcel 2 Highcrest Rd
- 3216 N Main St
- 59 Glendale St
- 3636 N Main St Unit 5
- 33 Warner St
- 3853 N Main St
- 257 Calvin St
- 172 Gibbs St
- 201 Montgomery Cir
- 4234 N Main St Unit 103
- 230 College Park Rd
- 1810 Highland Ave Unit 22
- 274 Archer St
- 2714 Riverside Ave
- 29 Valentine St
- 22 Apple Creek Ln
- 247 Albany St
Your Personal Tour Guide
Ask me questions while you tour the home.