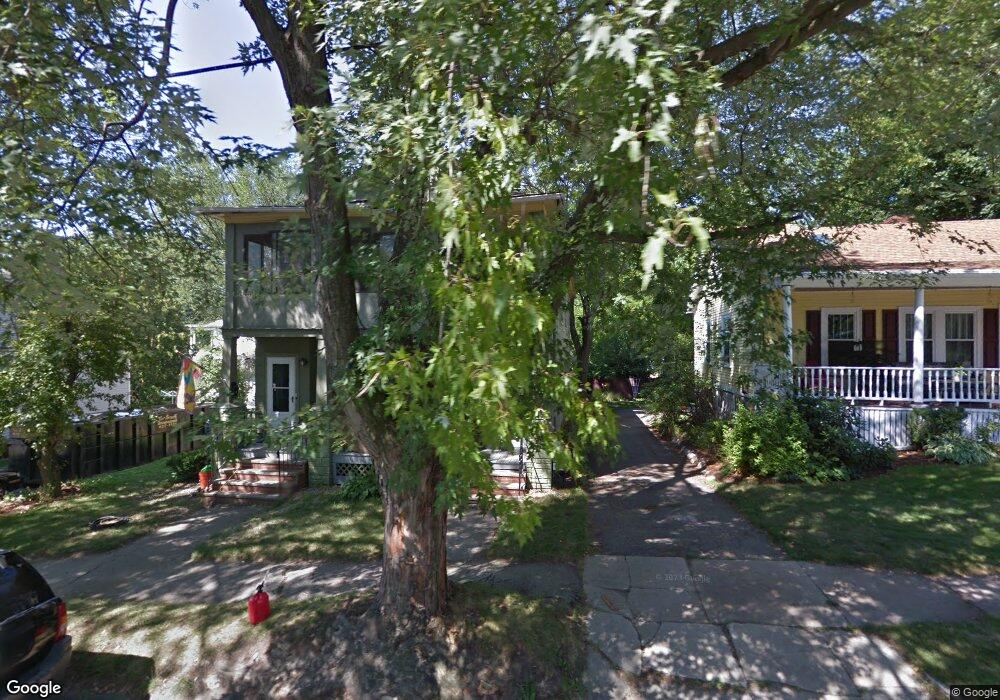
182 Linden St Manchester, NH 03104
Straw-Smyth NeighborhoodEstimated Value: $548,705 - $640,000
5
Beds
2
Baths
2,590
Sq Ft
$233/Sq Ft
Est. Value
About This Home
This home is located at 182 Linden St, Manchester, NH 03104 and is currently estimated at $602,676, approximately $232 per square foot. 182 Linden St is a home located in Hillsborough County with nearby schools including Smyth Road School, Hillside Middle School, and Manchester Central High School.
Ownership History
Date
Name
Owned For
Owner Type
Purchase Details
Closed on
Sep 27, 2012
Sold by
Serenity Props Llc
Bought by
Eames Daryl and Castillo Raquel
Current Estimated Value
Purchase Details
Closed on
Jul 12, 2011
Sold by
Brown Mary P
Bought by
Serenity Properties Ll
Home Financials for this Owner
Home Financials are based on the most recent Mortgage that was taken out on this home.
Original Mortgage
$180,250
Interest Rate
4.6%
Mortgage Type
Purchase Money Mortgage
Create a Home Valuation Report for This Property
The Home Valuation Report is an in-depth analysis detailing your home's value as well as a comparison with similar homes in the area
Home Values in the Area
Average Home Value in this Area
Purchase History
| Date | Buyer | Sale Price | Title Company |
|---|---|---|---|
| Eames Daryl | $258,000 | -- | |
| Eames Daryl | $258,000 | -- | |
| Serenity Properties Ll | $140,000 | -- | |
| Serenity Properties Ll | $140,000 | -- |
Source: Public Records
Mortgage History
| Date | Status | Borrower | Loan Amount |
|---|---|---|---|
| Previous Owner | Serenity Properties Ll | $35,000 | |
| Previous Owner | Serenity Properties Ll | $180,250 | |
| Closed | Serenity Properties Ll | $0 |
Source: Public Records
Tax History Compared to Growth
Tax History
| Year | Tax Paid | Tax Assessment Tax Assessment Total Assessment is a certain percentage of the fair market value that is determined by local assessors to be the total taxable value of land and additions on the property. | Land | Improvement |
|---|---|---|---|---|
| 2024 | $8,181 | $417,800 | $110,100 | $307,700 |
| 2023 | $7,880 | $417,800 | $110,100 | $307,700 |
| 2022 | $7,621 | $417,800 | $110,100 | $307,700 |
| 2021 | $7,387 | $417,800 | $110,100 | $307,700 |
| 2020 | $6,315 | $256,100 | $75,900 | $180,200 |
| 2019 | $5,923 | $256,100 | $75,900 | $180,200 |
| 2018 | $6,142 | $256,100 | $75,900 | $180,200 |
| 2017 | $5,733 | $256,100 | $75,900 | $180,200 |
| 2016 | $5,409 | $256,100 | $75,900 | $180,200 |
| 2015 | $5,447 | $232,400 | $69,600 | $162,800 |
| 2014 | $5,461 | $232,400 | $69,600 | $162,800 |
| 2013 | $5,269 | $232,400 | $69,600 | $162,800 |
Source: Public Records
Map
Nearby Homes