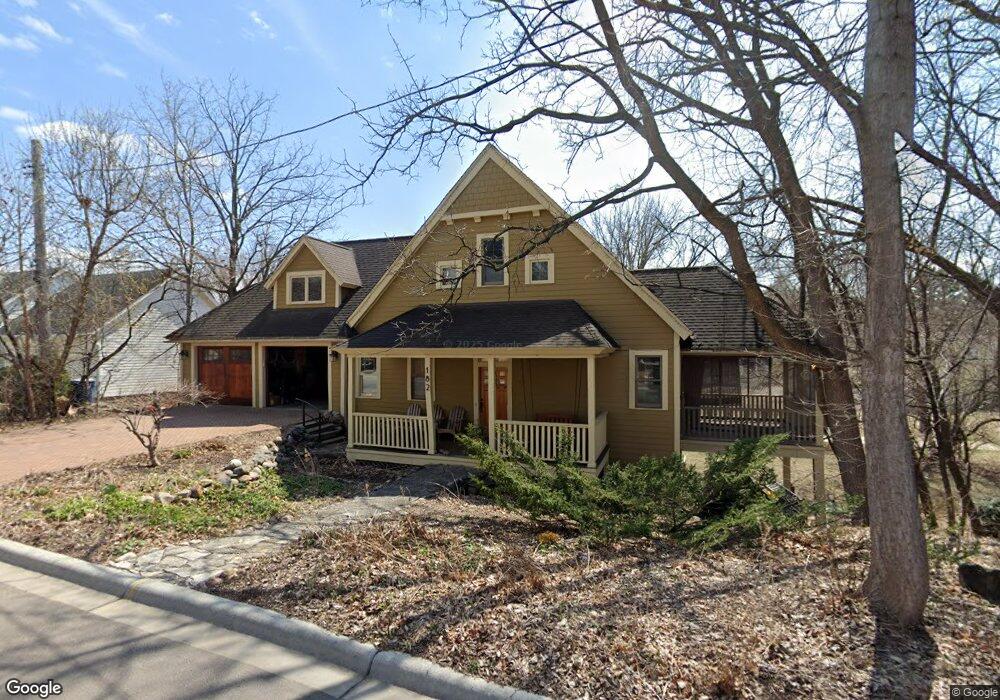
182 Maple St Excelsior, MN 55331
Estimated Value: $1,126,985 - $1,931,000
1
Bed
3
Baths
2,252
Sq Ft
$651/Sq Ft
Est. Value
About This Home
This home is located at 182 Maple St, Excelsior, MN 55331 and is currently estimated at $1,464,996, approximately $650 per square foot. 182 Maple St is a home located in Hennepin County with nearby schools including Excelsior Elementary School, Minnetonka West Middle School, and Minnetonka Senior High School.
Ownership History
Date
Name
Owned For
Owner Type
Purchase Details
Closed on
Apr 20, 1999
Sold by
Martinson Kurt R and Martinson Kimberly J
Bought by
Carver-Scott Educational Cooperative #93
Current Estimated Value
Create a Home Valuation Report for This Property
The Home Valuation Report is an in-depth analysis detailing your home's value as well as a comparison with similar homes in the area
Home Values in the Area
Average Home Value in this Area
Purchase History
| Date | Buyer | Sale Price | Title Company |
|---|---|---|---|
| Carver-Scott Educational Cooperative #93 | $48,000 | -- |
Source: Public Records
Tax History
| Year | Tax Paid | Tax Assessment Tax Assessment Total Assessment is a certain percentage of the fair market value that is determined by local assessors to be the total taxable value of land and additions on the property. | Land | Improvement |
|---|---|---|---|---|
| 2024 | $15,201 | $1,130,900 | $621,000 | $509,900 |
| 2023 | $14,854 | $1,137,100 | $621,000 | $516,100 |
| 2022 | $13,322 | $1,013,000 | $518,000 | $495,000 |
| 2021 | $12,857 | $939,000 | $518,000 | $421,000 |
| 2020 | $12,268 | $911,000 | $501,000 | $410,000 |
| 2019 | $10,606 | $848,000 | $467,000 | $381,000 |
| 2018 | $9,631 | $744,000 | $406,000 | $338,000 |
| 2017 | $8,304 | $590,000 | $285,000 | $305,000 |
| 2016 | $7,376 | $523,000 | $217,000 | $306,000 |
| 2015 | $7,011 | $494,000 | $194,000 | $300,000 |
| 2014 | -- | $409,000 | $124,000 | $285,000 |
Source: Public Records
Map
Nearby Homes
- 210 George St
- 161 3rd St
- 163 2nd St
- 185 W Lake St
- 101 Center St
- 254 Lake St
- 6591 Galpin Blvd
- 401 Highway 7
- 205 Mill St Unit S205
- 332 Mill St
- 400 Mill St
- 516 Grace St
- 6040 Oakview Ct
- 5730 Echo Rd
- 5631 Buffington Ln
- 5635 Buffington Ln
- 5651 Buffington Ln
- 5655 Buffington Ln
- 5615 Buffington Ln
- 85 Brentwood Ave
Your Personal Tour Guide
Ask me questions while you tour the home.