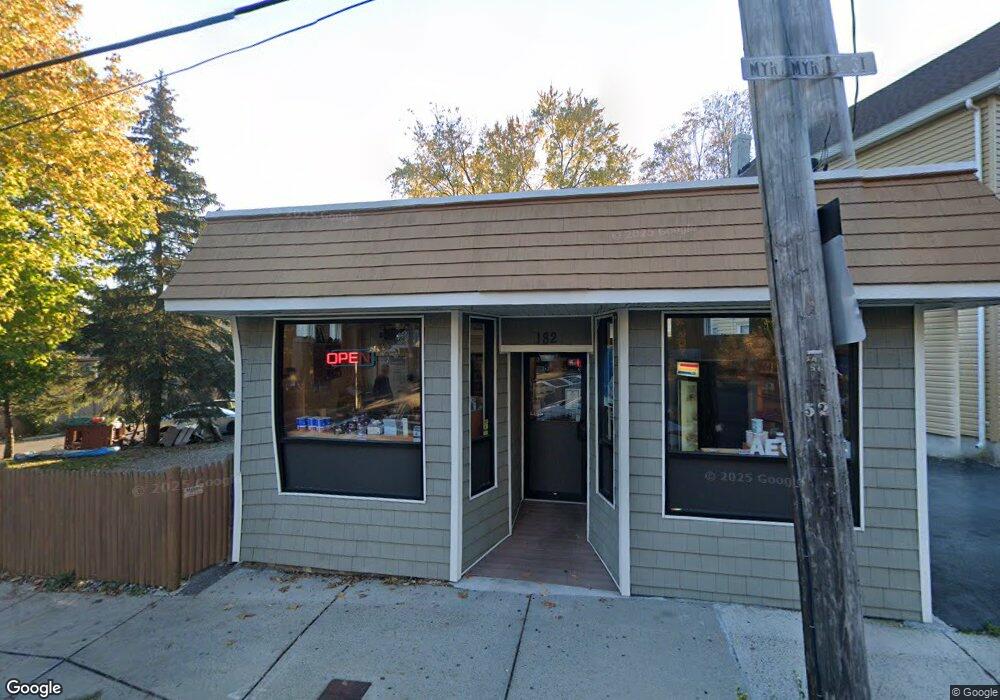
182 Myrtle St Lynn, MA 01905
Upper Walnut Street NeighborhoodEstimated Value: $343,193
--
Bed
1
Bath
653
Sq Ft
$526/Sq Ft
Est. Value
About This Home
This home is located at 182 Myrtle St, Lynn, MA 01905 and is currently estimated at $343,193, approximately $525 per square foot. 182 Myrtle St is a home located in Essex County with nearby schools including Lincoln-Thomson Elementary School, William R. Fallon School, and Breed Middle School.
Ownership History
Date
Name
Owned For
Owner Type
Purchase Details
Closed on
Feb 4, 2022
Sold by
182 Myrtle St Rt
Bought by
Satterwhite Michael A
Current Estimated Value
Purchase Details
Closed on
Oct 31, 2012
Sold by
Bayview Loan Svcng Llc
Bought by
182 Myrtle Street Rt
Home Financials for this Owner
Home Financials are based on the most recent Mortgage that was taken out on this home.
Original Mortgage
$63,350
Interest Rate
3.5%
Mortgage Type
Commercial
Purchase Details
Closed on
Mar 21, 2012
Sold by
Perez Efres N
Bought by
Bayview Loan Svcng Llc
Purchase Details
Closed on
Nov 13, 2007
Sold by
Perez Efres N and Perez Jose A
Bought by
Perez Efres N
Purchase Details
Closed on
Dec 2, 1999
Sold by
Hollow Thomas F and Hollow Marjorie L
Bought by
Perez Jose A and Perez Efres N
Home Financials for this Owner
Home Financials are based on the most recent Mortgage that was taken out on this home.
Original Mortgage
$80,000
Interest Rate
7.86%
Mortgage Type
Commercial
Create a Home Valuation Report for This Property
The Home Valuation Report is an in-depth analysis detailing your home's value as well as a comparison with similar homes in the area
Home Values in the Area
Average Home Value in this Area
Purchase History
| Date | Buyer | Sale Price | Title Company |
|---|---|---|---|
| Satterwhite Michael A | $275,000 | None Available | |
| Satterwhite Michael A | $275,000 | None Available | |
| 182 Myrtle Street Rt | $90,500 | -- | |
| Bayview Loan Svcng Llc | $80,300 | -- | |
| Bayview Loan Svcng Llc | $80,300 | -- | |
| Perez Efres N | -- | -- | |
| Perez Efres N | -- | -- | |
| Perez Jose A | $100,000 | -- | |
| Perez Jose A | $100,000 | -- |
Source: Public Records
Mortgage History
| Date | Status | Borrower | Loan Amount |
|---|---|---|---|
| Previous Owner | Perez Jose A | $63,350 | |
| Previous Owner | Perez Jose A | $80,000 |
Source: Public Records
Tax History Compared to Growth
Tax History
| Year | Tax Paid | Tax Assessment Tax Assessment Total Assessment is a certain percentage of the fair market value that is determined by local assessors to be the total taxable value of land and additions on the property. | Land | Improvement |
|---|---|---|---|---|
| 2025 | $5,493 | $276,600 | $192,000 | $84,600 |
| 2024 | $5,237 | $259,500 | $182,500 | $77,000 |
| 2023 | $5,197 | $243,400 | $167,600 | $75,800 |
| 2022 | $4,652 | $196,300 | $146,200 | $50,100 |
| 2021 | $4,841 | $193,500 | $143,400 | $50,100 |
| 2020 | $4,739 | $183,200 | $134,800 | $48,400 |
| 2019 | $4,619 | $167,300 | $123,400 | $43,900 |
| 2018 | $4,418 | $150,000 | $108,800 | $41,200 |
| 2017 | $4,594 | $149,800 | $108,800 | $41,000 |
| 2016 | $4,617 | $144,000 | $104,600 | $39,400 |
| 2015 | $4,836 | $144,000 | $104,600 | $39,400 |
Source: Public Records
Map
Nearby Homes
- 268 Walnut St
- 32 Birch Brook Rd Unit 13
- 32 Birch Brook Rd Unit 27
- 32 Birch Brook Rd Unit 16
- 32 Birch Brook Rd Unit 1
- 32 Birch Brook Rd Unit 15
- 32 Birch Brook Rd Unit 25
- 32 Birch Brook Rd Unit 22
- 32 Birch Brook Rd Unit 28
- 110 Holyoke St
- 35 Curran Rd
- 28 Wyman St
- 27 Bradford Terrace
- 93 Robinson St
- 50-50A Kirtland St
- 100 Ashland St
- 447 Boston St
- 10 Carnes St
- 75 Moulton St
- 11 Linwood Rd
- 302-304 Walnut St
- 302 Walnut St Unit 304
- 180 Myrtle St
- 180 Myrtle St Unit 1
- 174 Myrtle St
- 306 Walnut St
- 170 Myrtle St
- 177 Myrtle St
- 178 Myrtle St
- 178 Myrtle St Unit 2
- 312 Walnut St
- 168 Myrtle St
- 10 Perkins St
- 176 Myrtle St
- 186 Myrtle St
- 14 Perkins St
- 164 Myrtle St
- 9 Dungeon Ave Unit 11
- 9 Dungeon Ave Unit 1
- 171 Myrtle St