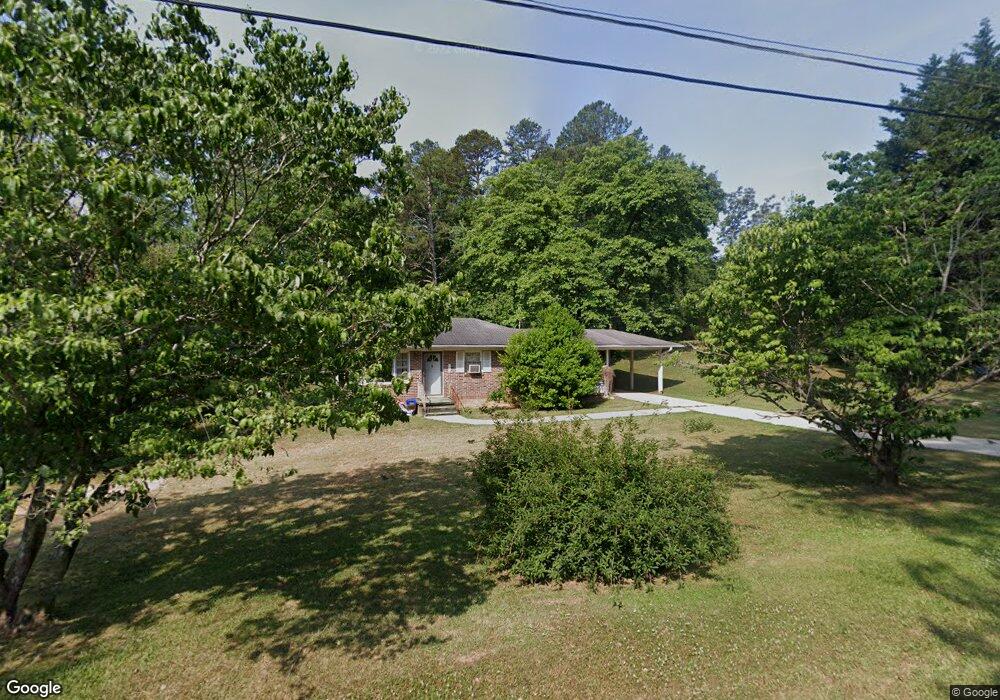
182 Myrtle St Toccoa, GA 30577
Estimated Value: $92,000 - $173,000
2
Beds
1
Bath
925
Sq Ft
$147/Sq Ft
Est. Value
About This Home
This home is located at 182 Myrtle St, Toccoa, GA 30577 and is currently estimated at $135,963, approximately $146 per square foot. 182 Myrtle St is a home located in Stephens County with nearby schools including Stephens County High School.
Ownership History
Date
Name
Owned For
Owner Type
Purchase Details
Closed on
Mar 19, 2024
Sold by
Payne April
Bought by
Jones Tyler
Current Estimated Value
Home Financials for this Owner
Home Financials are based on the most recent Mortgage that was taken out on this home.
Original Mortgage
$71,000
Outstanding Balance
$54,120
Interest Rate
6.9%
Mortgage Type
New Conventional
Estimated Equity
$81,843
Purchase Details
Closed on
Mar 14, 2024
Sold by
Payne Rodney Joe
Bought by
Payne April
Home Financials for this Owner
Home Financials are based on the most recent Mortgage that was taken out on this home.
Original Mortgage
$71,000
Outstanding Balance
$54,120
Interest Rate
6.9%
Mortgage Type
New Conventional
Estimated Equity
$81,843
Purchase Details
Closed on
Feb 28, 2020
Sold by
Payne Rodney Joe
Bought by
Payne Rodney Joe and Payne Sandra
Purchase Details
Closed on
Apr 9, 2015
Sold by
Payne Etta Ruth
Bought by
Payne Rodney Joe
Purchase Details
Closed on
Jun 22, 1956
Sold by
Martin Lumber Company
Bought by
Payne Joe Doyle and Etta Ruth
Create a Home Valuation Report for This Property
The Home Valuation Report is an in-depth analysis detailing your home's value as well as a comparison with similar homes in the area
Purchase History
| Date | Buyer | Sale Price | Title Company |
|---|---|---|---|
| Jones Tyler | $75,000 | -- | |
| Payne April | -- | -- | |
| Payne Rodney Joe | -- | -- | |
| Payne Rodney Joe | -- | -- | |
| Payne Joe Doyle | -- | -- |
Source: Public Records
Mortgage History
| Date | Status | Borrower | Loan Amount |
|---|---|---|---|
| Open | Jones Tyler | $71,000 |
Source: Public Records
Tax History
| Year | Tax Paid | Tax Assessment Tax Assessment Total Assessment is a certain percentage of the fair market value that is determined by local assessors to be the total taxable value of land and additions on the property. | Land | Improvement |
|---|---|---|---|---|
| 2025 | $1,243 | $35,629 | $4,118 | $31,511 |
| 2024 | $884 | $24,791 | $4,118 | $20,673 |
| 2023 | $823 | $23,272 | $4,118 | $19,154 |
| 2022 | $662 | $22,231 | $4,118 | $18,113 |
| 2021 | $642 | $20,521 | $4,118 | $16,403 |
| 2020 | $643 | $20,354 | $4,118 | $16,236 |
| 2019 | $646 | $20,373 | $4,137 | $16,236 |
| 2018 | $646 | $20,373 | $4,137 | $16,236 |
| 2017 | $656 | $20,373 | $4,137 | $16,236 |
| 2016 | $646 | $20,372 | $4,136 | $16,236 |
| 2015 | -- | $20,405 | $4,136 | $16,268 |
| 2014 | -- | $21,217 | $4,137 | $17,080 |
| 2013 | -- | $21,216 | $4,136 | $17,080 |
Source: Public Records
Map
Nearby Homes
- 148 Moreland Dr
- 110 Valley Rd
- 899 E Doyle St
- 29 Mountain View Dr
- 327 Ayers Creek Dr
- 43 Mountain View Dr
- 45 Hayes St
- 0 E Currahee St Unit 10544607
- 41 Norwood Ave
- 0 Hwy 17 Alt Unit 10577119
- 117 Glencrest Dr
- 391 Rosedale St
- 81 Boulder Dr
- 1168 Rosedale St
- 694 Lovers Ln
- 1292 Fernside Dr
- 90 Elm Dr
- 73 Ridgeview Heights
- 84 Oak Creek Cir
- 22 Green Hill Place
Your Personal Tour Guide
Ask me questions while you tour the home.