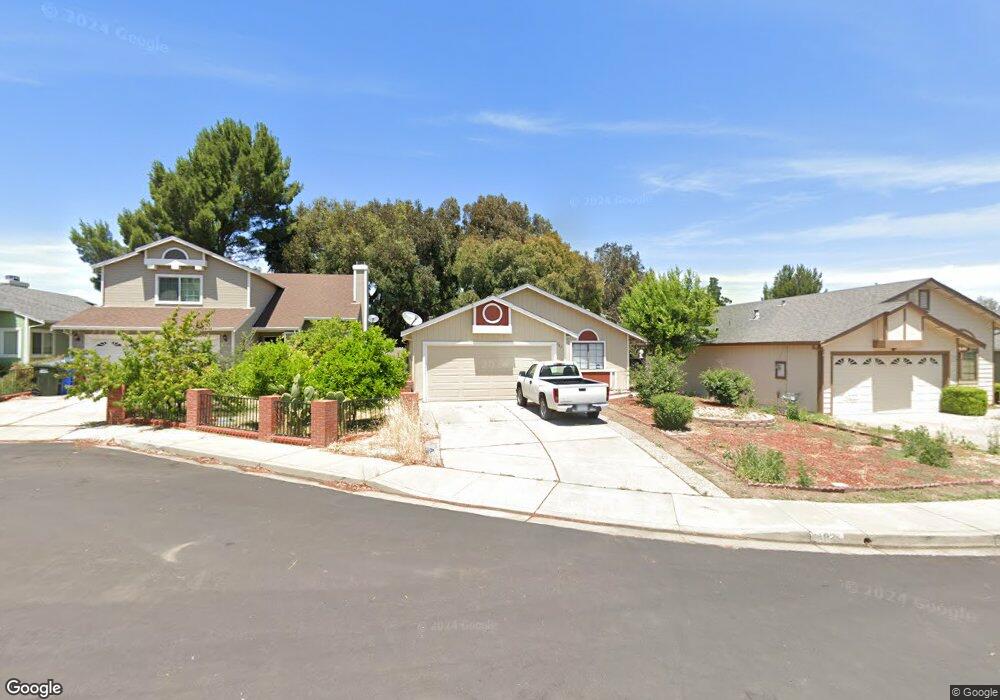
182 Sand Pointe Ln Bay Point, CA 94565
Estimated Value: $504,020 - $582,000
2
Beds
2
Baths
1,018
Sq Ft
$528/Sq Ft
Est. Value
About This Home
This home is located at 182 Sand Pointe Ln, Bay Point, CA 94565 and is currently estimated at $537,755, approximately $528 per square foot. 182 Sand Pointe Ln is a home located in Contra Costa County with nearby schools including Rio Vista Elementary School, Riverview Middle School, and Mt. Diablo High School.
Ownership History
Date
Name
Owned For
Owner Type
Purchase Details
Closed on
Jul 28, 2016
Sold by
Perry Rose Ann and Rice David L
Bought by
Carter Jimmy R
Current Estimated Value
Home Financials for this Owner
Home Financials are based on the most recent Mortgage that was taken out on this home.
Original Mortgage
$313,115
Outstanding Balance
$250,472
Interest Rate
3.56%
Mortgage Type
VA
Estimated Equity
$287,283
Purchase Details
Closed on
Feb 22, 2012
Sold by
Perry Rose Ann
Bought by
Perry Rose Ann and Rice David L
Home Financials for this Owner
Home Financials are based on the most recent Mortgage that was taken out on this home.
Original Mortgage
$89,566
Interest Rate
3.84%
Mortgage Type
New Conventional
Purchase Details
Closed on
Aug 2, 1995
Sold by
Turner Mary E
Bought by
Perry Rose Ann
Home Financials for this Owner
Home Financials are based on the most recent Mortgage that was taken out on this home.
Original Mortgage
$122,500
Interest Rate
7.61%
Mortgage Type
Purchase Money Mortgage
Create a Home Valuation Report for This Property
The Home Valuation Report is an in-depth analysis detailing your home's value as well as a comparison with similar homes in the area
Home Values in the Area
Average Home Value in this Area
Purchase History
| Date | Buyer | Sale Price | Title Company |
|---|---|---|---|
| Carter Jimmy R | $340,000 | Chicago Title Company | |
| Perry Rose Ann | -- | Fidelity National Title Co | |
| Perry Rose Ann | $126,000 | Commonwealth Land Title Co |
Source: Public Records
Mortgage History
| Date | Status | Borrower | Loan Amount |
|---|---|---|---|
| Open | Carter Jimmy R | $313,115 | |
| Previous Owner | Perry Rose Ann | $89,566 | |
| Previous Owner | Perry Rose Ann | $122,500 |
Source: Public Records
Tax History
| Year | Tax Paid | Tax Assessment Tax Assessment Total Assessment is a certain percentage of the fair market value that is determined by local assessors to be the total taxable value of land and additions on the property. | Land | Improvement |
|---|---|---|---|---|
| 2025 | $5,373 | $394,592 | $197,296 | $197,296 |
| 2024 | $5,123 | $386,856 | $193,428 | $193,428 |
| 2023 | $5,123 | $379,272 | $189,636 | $189,636 |
| 2022 | $5,087 | $371,836 | $185,918 | $185,918 |
| 2021 | $4,974 | $364,546 | $182,273 | $182,273 |
| 2019 | $4,860 | $353,736 | $176,868 | $176,868 |
| 2018 | $4,699 | $346,800 | $173,400 | $173,400 |
| 2017 | $4,559 | $340,000 | $170,000 | $170,000 |
| 2016 | $2,725 | $177,500 | $70,155 | $107,345 |
| 2015 | $2,693 | $174,835 | $69,102 | $105,733 |
| 2014 | $2,647 | $171,411 | $67,749 | $103,662 |
Source: Public Records
Map
Nearby Homes
- 130 Savona Way
- 3777 Willow Pass Rd Unit 85
- 3777 Willow Pass Rd Unit 20
- 215 San Bernardino Ct
- 166 San Joaquin Ct
- 2300 Verona Dr
- 1205 Villa Terrace Dr
- 417 Mystic Ln
- 621 Bounty Dr
- 55 Pacifica Ave Unit 49
- 55 Pacifica Ave Unit 90
- 55 Pacifica Ave Unit 77
- 55 Pacifica Ave Unit 146
- 97 Harbor Dr
- 93 Beach Dr
- 92 Beach Dr
- 87 Bay Dr
- 469 Powell Dr
- 28 Springbrook Ln
- 94 Anchor Dr
- 174 Sand Pointe Ln
- 190 Sand Pointe Ln
- 198 Sand Pointe Ln
- 158 Sand Pointe Ln
- 10 Sea Cliff Place
- 181 Sand Pointe Ln
- 8 Sea Cliff Place
- 173 Sand Pointe Ln
- 150 Sand Pointe Ln
- 197 Sand Pointe Ln
- 165 Sand Pointe Ln
- 142 Sand Pointe Ln
- 6 Sea Cliff Place
- 219 Sandy Cove Ln
- 227 Sandy Cove Ln
- 149 Sand Pointe Ln
- 134 Sand Pointe Ln
- 235 Sandy Cove Ln
- 4 Sea Cliff Place
- 141 Sand Pointe Ln
Your Personal Tour Guide
Ask me questions while you tour the home.