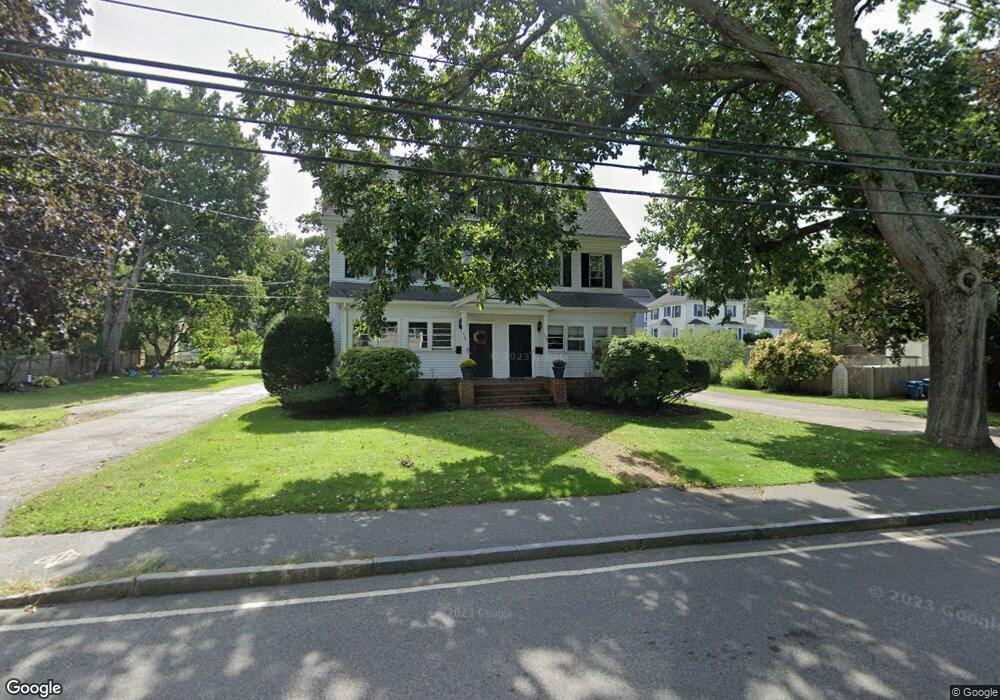
182 Sherman St Canton, MA 02021
Estimated Value: $852,039 - $1,181,000
6
Beds
2
Baths
4,125
Sq Ft
$241/Sq Ft
Est. Value
About This Home
This home is located at 182 Sherman St, Canton, MA 02021 and is currently estimated at $995,760, approximately $241 per square foot. 182 Sherman St is a home located in Norfolk County with nearby schools including Canton High School and St. John the Evangelist School.
Ownership History
Date
Name
Owned For
Owner Type
Purchase Details
Closed on
May 21, 2025
Sold by
Gorka Robert J and Gorka Linda A
Bought by
Gorka Ft and Gorka
Current Estimated Value
Purchase Details
Closed on
Jul 15, 2022
Sold by
J Gorka T R
Bought by
Gorka Robert J
Purchase Details
Closed on
Jul 24, 2017
Sold by
Gorka Phyllis A Est and Gorka
Bought by
Peter J Gorka T J and Peter Gorka
Purchase Details
Closed on
Dec 30, 2016
Sold by
Gorka Peter J and Gorka Phyllis A
Bought by
Gorka Phyllis A
Purchase Details
Closed on
Nov 26, 2013
Sold by
Gorka Peter J and Gorka Phyllis A
Bought by
Gorka Ft and Gorka
Create a Home Valuation Report for This Property
The Home Valuation Report is an in-depth analysis detailing your home's value as well as a comparison with similar homes in the area
Home Values in the Area
Average Home Value in this Area
Purchase History
| Date | Buyer | Sale Price | Title Company |
|---|---|---|---|
| Gorka Ft | -- | None Available | |
| Gorka Ft | -- | None Available | |
| Gorka Robert J | -- | None Available | |
| Gorka Robert J | -- | None Available | |
| J Gorka T R | -- | None Available | |
| J Gorka T R | -- | None Available | |
| Peter J Gorka Lt | -- | None Available | |
| Peter J Gorka Lt | -- | None Available | |
| Peter J Gorka T J | -- | -- | |
| Peter J Gorka T J | -- | -- | |
| Gorka Phyllis A | -- | -- | |
| Gorka Phyllis A | -- | -- | |
| Gorka Peter J | -- | -- | |
| Gorka Peter J | -- | -- | |
| Gorka Robert J | -- | -- | |
| Gorka Robert J | -- | -- | |
| Gorka Ft | -- | -- | |
| Gorka Ft | -- | -- |
Source: Public Records
Tax History
| Year | Tax Paid | Tax Assessment Tax Assessment Total Assessment is a certain percentage of the fair market value that is determined by local assessors to be the total taxable value of land and additions on the property. | Land | Improvement |
|---|---|---|---|---|
| 2025 | $7,392 | $747,400 | $305,800 | $441,600 |
| 2024 | $7,165 | $718,700 | $294,000 | $424,700 |
| 2023 | $6,919 | $654,600 | $294,000 | $360,600 |
| 2022 | $6,625 | $583,700 | $280,000 | $303,700 |
| 2021 | $6,448 | $528,500 | $254,500 | $274,000 |
| 2020 | $6,157 | $503,400 | $242,400 | $261,000 |
| 2019 | $5,796 | $467,400 | $220,300 | $247,100 |
| 2018 | $5,585 | $449,700 | $211,900 | $237,800 |
| 2017 | $5,642 | $441,100 | $207,800 | $233,300 |
| 2016 | $5,506 | $430,500 | $202,700 | $227,800 |
| 2015 | $5,333 | $416,000 | $196,800 | $219,200 |
Source: Public Records
Map
Nearby Homes
- 20 Audubon Way Unit 205
- 20 Audubon Way Unit 302
- 20 Audubon Way Unit 408
- 20 Audubon Way Unit 105
- 20 Audubon Way Unit 109
- 20 Audubon Way Unit 104
- 20 Audubon Way Unit 101
- 12 Danforth St
- 16 Danforth St
- 8 Audubon Way
- 865 Washington St Unit 6
- 26 Pequit St
- 611 Pleasant St
- 24 Forge Pond Unit H
- 4 Forge Pond Unit D
- 651 Washington St
- 859 Pleasant St
- 60 Coppersmith Way Unit 304
- 77 Neponset St Unit 77
- 19 Pine St Unit K
- 184 Sherman St
- 184 Sherman St Unit 2
- 170 Sherman St
- 196 Sherman St
- 11 Sherman Ave
- 20 Leonard St
- 17 Sherman Ave
- 22 Leonard St
- 32 Leonard St
- 29 Sherman Ave
- 183 Sherman St
- 162 Sherman St
- 171 Sherman St
- 193 Sherman St
- 210 Sherman St
- 209 Sherman St
- 33 Sherman Ave
- 20 Sherman Ave
- 23 Leonard St
- 154 Sherman St
Your Personal Tour Guide
Ask me questions while you tour the home.