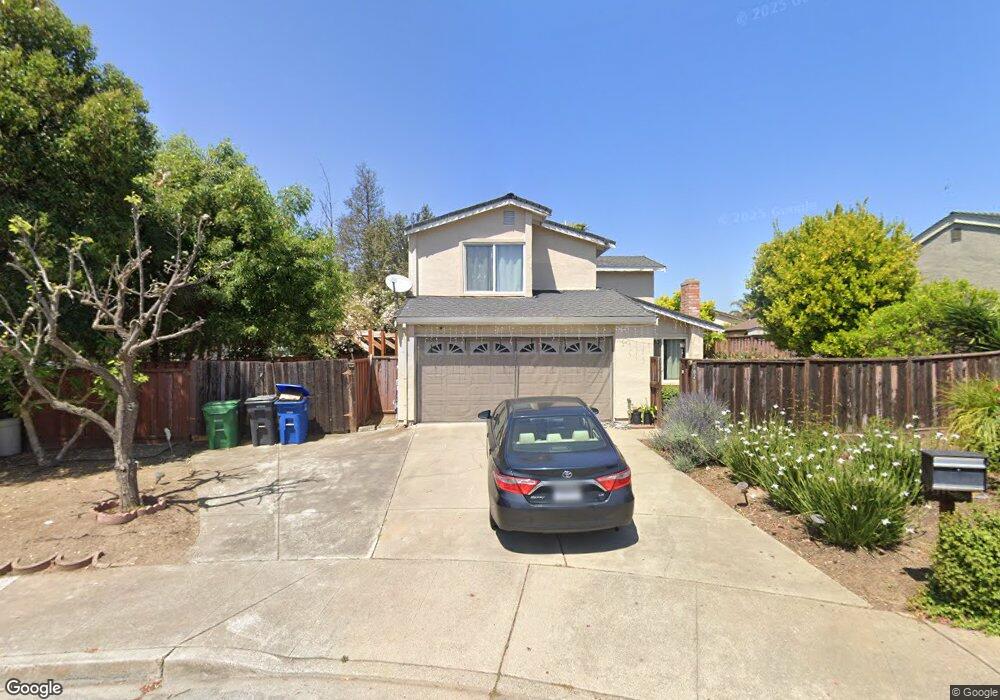
182 Stanislaus Way Hayward, CA 94544
Whitman-Wocine NeighborhoodEstimated Value: $893,000 - $996,000
4
Beds
3
Baths
1,499
Sq Ft
$636/Sq Ft
Est. Value
About This Home
This home is located at 182 Stanislaus Way, Hayward, CA 94544 and is currently estimated at $952,777, approximately $635 per square foot. 182 Stanislaus Way is a home located in Alameda County with nearby schools including Tyrrell Elementary School, Cesar Chavez Middle School, and Tennyson High School.
Ownership History
Date
Name
Owned For
Owner Type
Purchase Details
Closed on
May 16, 2018
Sold by
Moala Henele Scott and Moala Yemeseratch
Bought by
Moala Henele Scott and Moala Yemeseratch
Current Estimated Value
Home Financials for this Owner
Home Financials are based on the most recent Mortgage that was taken out on this home.
Original Mortgage
$524,700
Interest Rate
4.4%
Mortgage Type
New Conventional
Purchase Details
Closed on
Jun 23, 2015
Sold by
Vanvelden Rick E and Xu Liyuan
Bought by
Moala Henele Scott and Moala Yemeseratch
Home Financials for this Owner
Home Financials are based on the most recent Mortgage that was taken out on this home.
Original Mortgage
$540,038
Interest Rate
3.99%
Mortgage Type
FHA
Purchase Details
Closed on
Sep 18, 2012
Sold by
Valdez Paul R and Lacebal Valdez Maria T
Bought by
Vanvelden Rick E and Xu Liyuan
Home Financials for this Owner
Home Financials are based on the most recent Mortgage that was taken out on this home.
Original Mortgage
$214,200
Interest Rate
3.55%
Mortgage Type
New Conventional
Create a Home Valuation Report for This Property
The Home Valuation Report is an in-depth analysis detailing your home's value as well as a comparison with similar homes in the area
Home Values in the Area
Average Home Value in this Area
Purchase History
| Date | Buyer | Sale Price | Title Company |
|---|---|---|---|
| Moala Henele Scott | -- | Fidelity National Title Comp | |
| Moala Henele Scott | $550,000 | Chicago Title Company | |
| Vanvelden Rick E | $306,000 | North American Title Company |
Source: Public Records
Mortgage History
| Date | Status | Borrower | Loan Amount |
|---|---|---|---|
| Previous Owner | Moala Henele Scott | $524,700 | |
| Previous Owner | Moala Henele Scott | $540,038 | |
| Previous Owner | Vanvelden Rick E | $214,200 |
Source: Public Records
Tax History Compared to Growth
Tax History
| Year | Tax Paid | Tax Assessment Tax Assessment Total Assessment is a certain percentage of the fair market value that is determined by local assessors to be the total taxable value of land and additions on the property. | Land | Improvement |
|---|---|---|---|---|
| 2025 | $7,854 | $644,073 | $195,322 | $455,751 |
| 2024 | $7,854 | $631,307 | $191,492 | $446,815 |
| 2023 | $7,735 | $625,794 | $187,738 | $438,056 |
| 2022 | $7,584 | $606,524 | $184,057 | $429,467 |
| 2021 | $7,521 | $594,495 | $180,448 | $421,047 |
| 2020 | $7,437 | $595,330 | $178,599 | $416,731 |
| 2019 | $7,497 | $583,660 | $175,098 | $408,562 |
| 2018 | $7,030 | $572,220 | $171,666 | $400,554 |
| 2017 | $6,866 | $561,000 | $168,300 | $392,700 |
| 2016 | $6,478 | $550,000 | $165,000 | $385,000 |
| 2015 | $3,855 | $313,530 | $94,059 | $219,471 |
| 2014 | $3,817 | $307,388 | $92,216 | $215,172 |
Source: Public Records
Map
Nearby Homes
- 250 Jacaranda Dr
- 266 Gloria St
- 250 Schafer Rd
- 399 Schafer Rd
- 26132 Jane Ave
- 26361 Huntwood Ave
- 26632 Luvena Dr
- 26517 Sunvale Ct Unit 3
- 27418 Susan Place Unit 3
- 26583 Greta Ln
- Plan 5-Alt at Fusion - Live-Work Homes
- Plan 5 at Fusion - Live-Work Homes
- Plan 1 at Fusion - Townhomes
- Plan 2 at Fusion - Townhomes
- Plan 6 at Fusion - Live-Work Homes
- Plan 3 at Fusion - Townhomes
- Plan 4 at Fusion - Townhomes
- 25943 Dollar St
- 318 Dumont Ave
- 26231 Gamboa St
- 190 Stanislaus Way
- 26661 Joshua St
- 194 Stanislaus Way
- 26653 Joshua St
- 187 Stanislaus Way
- 191 Stanislaus Way
- 183 Stanislaus Way
- 179 Stanislaus Way
- 26645 Joshua St
- 195 Stanislaus Way
- 26662 Joshua St
- 204 Steel St
- 26670 Joshua St
- 207 Stanislaus Way
- 26650 Joshua St
- 26678 Joshua St
- 26637 Joshua St
- 26642 Joshua St
- 223 Stanislaus Way
- 26634 Jane Ave