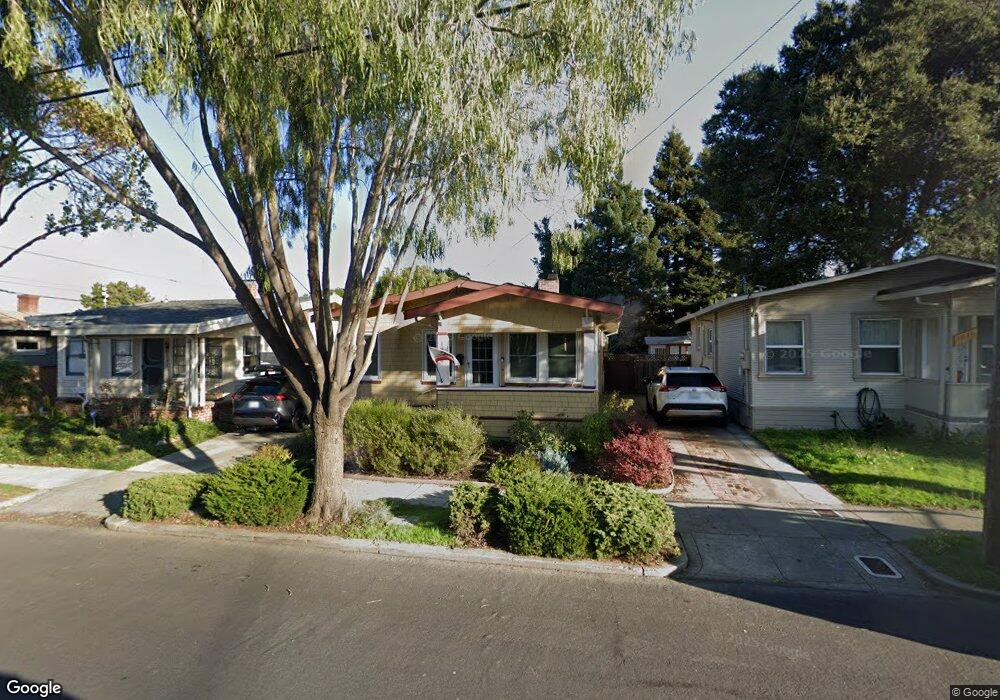
1820 Chestnut St Alameda, CA 94501
West Alameda NeighborhoodEstimated Value: $848,000 - $1,038,000
2
Beds
1
Bath
996
Sq Ft
$942/Sq Ft
Est. Value
About This Home
This home is located at 1820 Chestnut St, Alameda, CA 94501 and is currently estimated at $938,179, approximately $941 per square foot. 1820 Chestnut St is a home located in Alameda County with nearby schools including Love Elementary, Will C. Wood Middle School, and Alameda High School.
Ownership History
Date
Name
Owned For
Owner Type
Purchase Details
Closed on
Sep 25, 2018
Sold by
Szumiloski Kathryn M
Bought by
Fong Kelly and Fong Candice R
Current Estimated Value
Home Financials for this Owner
Home Financials are based on the most recent Mortgage that was taken out on this home.
Original Mortgage
$630,000
Outstanding Balance
$549,397
Interest Rate
4.5%
Mortgage Type
New Conventional
Estimated Equity
$388,782
Create a Home Valuation Report for This Property
The Home Valuation Report is an in-depth analysis detailing your home's value as well as a comparison with similar homes in the area
Home Values in the Area
Average Home Value in this Area
Purchase History
| Date | Buyer | Sale Price | Title Company |
|---|---|---|---|
| Fong Kelly | $788,500 | Fidelity National Title Comp |
Source: Public Records
Mortgage History
| Date | Status | Borrower | Loan Amount |
|---|---|---|---|
| Open | Fong Kelly | $630,000 |
Source: Public Records
Tax History Compared to Growth
Tax History
| Year | Tax Paid | Tax Assessment Tax Assessment Total Assessment is a certain percentage of the fair market value that is determined by local assessors to be the total taxable value of land and additions on the property. | Land | Improvement |
|---|---|---|---|---|
| 2025 | $12,215 | $879,571 | $263,871 | $615,700 |
| 2024 | $12,215 | $862,327 | $258,698 | $603,629 |
| 2023 | $11,731 | $845,421 | $253,626 | $591,795 |
| 2022 | $11,460 | $828,847 | $248,654 | $580,193 |
| 2021 | $11,168 | $812,595 | $243,778 | $568,817 |
| 2020 | $11,028 | $804,270 | $241,281 | $562,989 |
| 2019 | $10,648 | $788,500 | $236,550 | $551,950 |
| 2018 | $3,544 | $223,617 | $61,255 | $162,362 |
| 2017 | $3,395 | $219,234 | $60,055 | $159,179 |
| 2016 | $3,380 | $214,935 | $58,877 | $156,058 |
| 2015 | $3,361 | $211,708 | $57,993 | $153,715 |
| 2014 | $3,221 | $207,561 | $56,857 | $150,704 |
Source: Public Records
Map
Nearby Homes
- 2007 Stanford St
- 2015 Stanford St
- 2055 Clement Ave
- 2061 Buena Vista Ave
- 1805 Eagle Ave
- Plan 3 at Alameda Marina - Waterside
- 2388 Stanford St
- 5 Plan at Alameda Marina - Island View
- 1 Plan at Alameda Marina - Island View
- Plan 2 at Alameda Marina - Waterside
- Plan 1 at Alameda Marina - Waterside
- 4 Plan at Alameda Marina - Island View
- 6 Plan at Alameda Marina - Island View
- 2256 Stanford St
- 2364 Stanford St
- 1613 Union St
- 2109 Lincoln Ave
- 1520 Willow St
- 1933 Grand St
- 1937 Grand St
- 1816 Chestnut St
- 1824 Chestnut St
- 1812 Chestnut St
- 2006 Eagle Ave
- 1826 Chestnut St
- 1808 Chestnut St
- 2012 Eagle Ave
- 1821 Chestnut St
- 2009 Buena Vista Ave
- 1825 Chestnut St
- 1815 Chestnut St
- 1817 Chestnut St
- 2001 Buena Vista Ave
- 2007 Buena Vista Ave
- 2018 Eagle Ave
- 1827 Chestnut St
- 2015 Buena Vista Ave
- 1807 Chestnut St
- 2020 Eagle Ave
- 1908 Eagle Ave