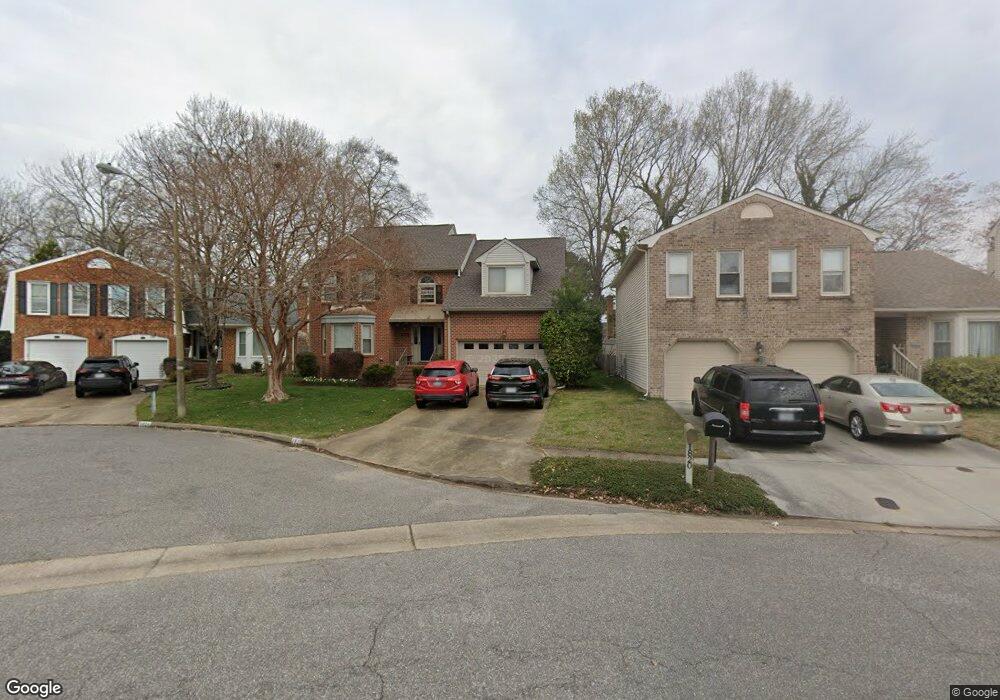
1820 Grey Friars Chase Virginia Beach, VA 23456
Salem NeighborhoodEstimated Value: $497,727 - $552,000
3
Beds
3
Baths
2,370
Sq Ft
$222/Sq Ft
Est. Value
About This Home
This home is located at 1820 Grey Friars Chase, Virginia Beach, VA 23456 and is currently estimated at $525,682, approximately $221 per square foot. 1820 Grey Friars Chase is a home located in Virginia Beach City with nearby schools including Rosemont Forest Elementary School, Salem Middle School, and Salem High School.
Ownership History
Date
Name
Owned For
Owner Type
Purchase Details
Closed on
Feb 14, 2018
Sold by
Mclaughlin Henry W
Bought by
Caalim Anthony L and Caalim Maria Victoria
Current Estimated Value
Home Financials for this Owner
Home Financials are based on the most recent Mortgage that was taken out on this home.
Original Mortgage
$300,000
Outstanding Balance
$255,524
Interest Rate
4.22%
Mortgage Type
VA
Estimated Equity
$270,158
Purchase Details
Closed on
Feb 26, 2016
Sold by
Bowers Matthew G
Bought by
Mclaughlin Henry W
Home Financials for this Owner
Home Financials are based on the most recent Mortgage that was taken out on this home.
Original Mortgage
$268,312
Interest Rate
3.92%
Mortgage Type
VA
Create a Home Valuation Report for This Property
The Home Valuation Report is an in-depth analysis detailing your home's value as well as a comparison with similar homes in the area
Home Values in the Area
Average Home Value in this Area
Purchase History
| Date | Buyer | Sale Price | Title Company |
|---|---|---|---|
| Caalim Anthony L | $334,000 | Title Resources Guaranty Co | |
| Mclaughlin Henry W | $330,000 | Titlequest Of Hampton Roads |
Source: Public Records
Mortgage History
| Date | Status | Borrower | Loan Amount |
|---|---|---|---|
| Open | Caalim Anthony L | $300,000 | |
| Previous Owner | Mclaughlin Henry W | $268,312 |
Source: Public Records
Tax History Compared to Growth
Tax History
| Year | Tax Paid | Tax Assessment Tax Assessment Total Assessment is a certain percentage of the fair market value that is determined by local assessors to be the total taxable value of land and additions on the property. | Land | Improvement |
|---|---|---|---|---|
| 2025 | $4,321 | $462,000 | $170,000 | $292,000 |
| 2024 | $4,321 | $445,500 | $170,000 | $275,500 |
| 2023 | $4,044 | $408,500 | $135,000 | $273,500 |
| 2022 | $3,604 | $364,000 | $115,000 | $249,000 |
| 2021 | $3,495 | $353,000 | $115,000 | $238,000 |
| 2020 | $3,311 | $325,400 | $115,000 | $210,400 |
| 2019 | $3,265 | $320,200 | $115,000 | $205,200 |
| 2018 | $3,210 | $320,200 | $115,000 | $205,200 |
| 2017 | $3,160 | $315,200 | $110,000 | $205,200 |
| 2016 | $3,071 | $310,200 | $110,000 | $200,200 |
| 2015 | $3,178 | $321,000 | $110,000 | $211,000 |
| 2014 | $2,663 | $315,200 | $117,000 | $198,200 |
Source: Public Records
Map
Nearby Homes
- 1652 Castlefield Rd
- 1900 Grey Friars Chase
- 1900 Haywards Heath
- 1637 Castlefield Rd
- 4305 Salem Springs Way
- 4357 Elderberry Ln
- 4521 Van Dyck Dr
- 1412 Athol Ct
- 1912 Bunnell Ct
- 1573 Wynd Crest Way
- 1425 Round Hill Dr
- 5224 Thatcher Way
- 4276 Derby Wharf Dr
- 1044 Villas Ct
- 5233 Thatcher Way
- 5245 Thatcher Way
- 4224 Turnworth Arch
- 1613 Cliffwood Dr
- 4225 Kenton Ln
- 1156 Eagle Way
- 1824 Grey Friars Chase
- 1816 Grey Friars Chase
- 1828 Grey Friars Chase
- 1857 Summerhedge Close
- 1861 Summerhedge Close
- 1812 Grey Friars Chase
- 1827 Grey Friars Chase
- 1809 Grey Friars Chase
- 1853 Summerhedge Close
- 1808 Grey Friars Chase
- 1832 Grey Friars Chase
- 1865 Summerhedge Close
- 1804 Grey Friars Chase
- 1805 Grey Friars Chase
- 1701 Handcross Way
- 1652 Castlefield Rd Unit Rd
- 1656 Castlefield Rd
- 1849 Summerhedge Close
- 1800 Grey Friars Chase
- 1648 Castlefield Rd