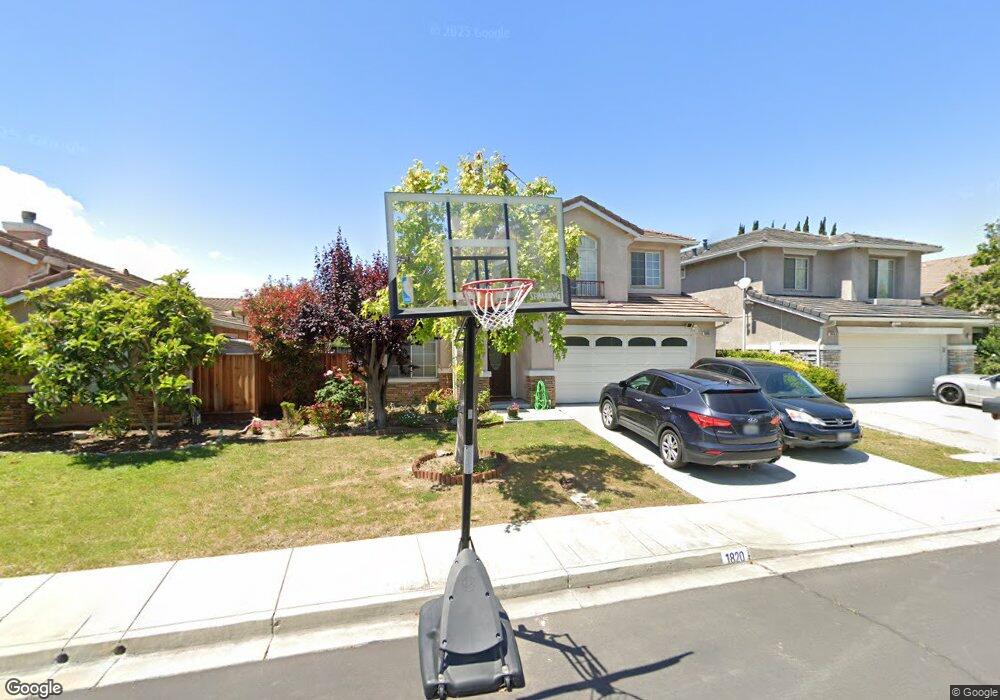
1820 Mirabella Dr Union City, CA 94587
Estimated Value: $1,481,912 - $1,712,000
3
Beds
3
Baths
1,851
Sq Ft
$855/Sq Ft
Est. Value
About This Home
This home is located at 1820 Mirabella Dr, Union City, CA 94587 and is currently estimated at $1,582,228, approximately $854 per square foot. 1820 Mirabella Dr is a home located in Alameda County with nearby schools including Tom Kitayama Elementary School, Cesar Chavez Middle School, and James Logan High School.
Ownership History
Date
Name
Owned For
Owner Type
Purchase Details
Closed on
Feb 21, 2020
Sold by
Vittaldas Sonia
Bought by
Vittaldas Sonia and The Sofia Vittaldas Revocable
Current Estimated Value
Purchase Details
Closed on
Jan 18, 2019
Sold by
Sharma Arun D and Vittaldas Sonia
Bought by
Vittaldas Sonia
Purchase Details
Closed on
Feb 22, 2001
Sold by
Rubinstein Leslie J
Bought by
Sharma Arun and Vittaldas Sonia
Home Financials for this Owner
Home Financials are based on the most recent Mortgage that was taken out on this home.
Original Mortgage
$439,200
Interest Rate
6.75%
Purchase Details
Closed on
Feb 16, 1999
Sold by
Kaufman & Broad South Bay Inc
Bought by
Rubinstein Leslie J
Home Financials for this Owner
Home Financials are based on the most recent Mortgage that was taken out on this home.
Original Mortgage
$227,150
Interest Rate
6.78%
Create a Home Valuation Report for This Property
The Home Valuation Report is an in-depth analysis detailing your home's value as well as a comparison with similar homes in the area
Home Values in the Area
Average Home Value in this Area
Purchase History
| Date | Buyer | Sale Price | Title Company |
|---|---|---|---|
| Vittaldas Sonia | -- | None Available | |
| Vittaldas Sonia | -- | None Available | |
| Sharma Arun | $549,000 | American Title Co | |
| Rubinstein Leslie J | $374,000 | First American Title Guarant |
Source: Public Records
Mortgage History
| Date | Status | Borrower | Loan Amount |
|---|---|---|---|
| Previous Owner | Sharma Arun | $439,200 | |
| Previous Owner | Rubinstein Leslie J | $227,150 | |
| Closed | Sharma Arun | $54,900 |
Source: Public Records
Tax History Compared to Growth
Tax History
| Year | Tax Paid | Tax Assessment Tax Assessment Total Assessment is a certain percentage of the fair market value that is determined by local assessors to be the total taxable value of land and additions on the property. | Land | Improvement |
|---|---|---|---|---|
| 2025 | $11,639 | $827,194 | $248,158 | $579,036 |
| 2024 | $11,639 | $810,977 | $243,293 | $567,684 |
| 2023 | $11,285 | $795,077 | $238,523 | $556,554 |
| 2022 | $11,099 | $779,491 | $233,847 | $545,644 |
| 2021 | $10,853 | $764,207 | $229,262 | $534,945 |
| 2020 | $10,607 | $756,373 | $226,912 | $529,461 |
| 2019 | $10,717 | $741,544 | $222,463 | $519,081 |
| 2018 | $10,472 | $727,007 | $218,102 | $508,905 |
| 2017 | $10,225 | $712,755 | $213,826 | $498,929 |
| 2016 | $9,854 | $698,783 | $209,635 | $489,148 |
| 2015 | $9,672 | $688,291 | $206,487 | $481,804 |
| 2014 | $9,311 | $674,814 | $202,444 | $472,370 |
Source: Public Records
Map
Nearby Homes
- 5375 Singh Cir
- 5325 Singh Cir
- 32613 Singh Cir
- 32333 Crest Ln
- 32625 Brenda Way Unit 1
- 32226 Crest Ln
- 2469 Ascot Way
- 2716 Killdeer Ct
- 2544 Franklin Ave Unit 172
- 2572 Parkside Dr
- 167 Kona Cir
- 23 Palm Dr
- 31959 Carroll Ave
- 30 Palm Dr Unit 30
- 192 Hawaii Cir
- 1028 Montoya Terrace Unit 2
- 259 Molokai Cir Unit 259
- 54 Lafayette Ave
- 328 Waikiki Cir
- 31274 Santa Maria Dr
- 1824 Mirabella Dr
- 1816 Mirabella Dr
- 1917 Abreu Way
- 1828 Mirabella Dr
- 1812 Mirabella Dr
- 1913 Abreu Way
- 1921 Abreu Way
- 1909 Abreu Way
- 1925 Abreu Way
- 1832 Mirabella Dr
- 1929 Abreu Way
- 1905 Abreu Way
- 1836 Mirabella Dr
- 1933 Abreu Way
- 1916 Abreu Way
- 1912 Abreu Way
- 1920 Abreu Way
- 1908 Abreu Way
- 1840 Mirabella Dr
- 1924 Abreu Way