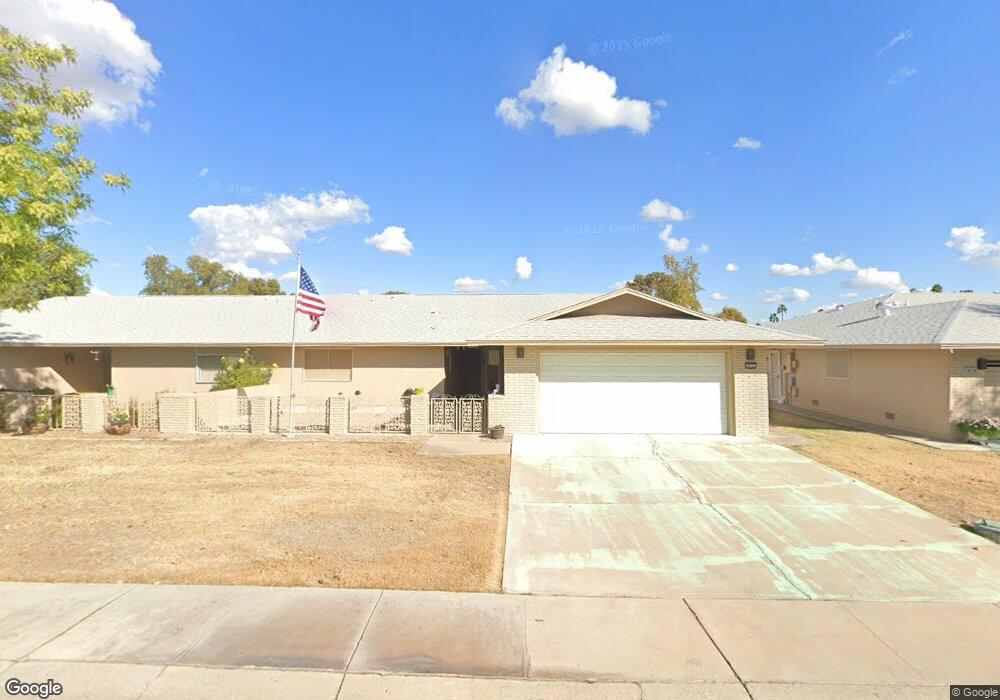
18201 N 99th Dr Sun City, AZ 85373
Estimated Value: $195,898 - $298,000
--
Bed
2
Baths
1,596
Sq Ft
$156/Sq Ft
Est. Value
About This Home
This home is located at 18201 N 99th Dr, Sun City, AZ 85373 and is currently estimated at $248,975, approximately $155 per square foot. 18201 N 99th Dr is a home located in Maricopa County with nearby schools including Sonoran Science Academy-Peoria and Black Mountain Science Academy Montessori.
Ownership History
Date
Name
Owned For
Owner Type
Purchase Details
Closed on
Jun 11, 1999
Sold by
Peck Calvin R and Peck Charlotte B
Bought by
Mick Paul G and Mick Grace F
Current Estimated Value
Home Financials for this Owner
Home Financials are based on the most recent Mortgage that was taken out on this home.
Original Mortgage
$58,000
Outstanding Balance
$15,486
Interest Rate
7.2%
Mortgage Type
New Conventional
Estimated Equity
$233,489
Purchase Details
Closed on
Sep 20, 1996
Sold by
Mccartney Raymond C and Mccartney Marjorie P
Bought by
Peck Calvin R and Peck Charlotte B
Home Financials for this Owner
Home Financials are based on the most recent Mortgage that was taken out on this home.
Original Mortgage
$73,600
Interest Rate
8.11%
Mortgage Type
New Conventional
Purchase Details
Closed on
Mar 20, 1996
Sold by
Hermstad Robert J
Bought by
Mccartney Raymond C and Mccartney Marjorie P
Create a Home Valuation Report for This Property
The Home Valuation Report is an in-depth analysis detailing your home's value as well as a comparison with similar homes in the area
Home Values in the Area
Average Home Value in this Area
Purchase History
| Date | Buyer | Sale Price | Title Company |
|---|---|---|---|
| Mick Paul G | $102,000 | First American Title | |
| Peck Calvin R | $92,000 | Ati Title Agency | |
| Mccartney Raymond C | $91,500 | United Title Agency |
Source: Public Records
Mortgage History
| Date | Status | Borrower | Loan Amount |
|---|---|---|---|
| Open | Mick Paul G | $58,000 | |
| Previous Owner | Peck Calvin R | $73,600 |
Source: Public Records
Tax History Compared to Growth
Tax History
| Year | Tax Paid | Tax Assessment Tax Assessment Total Assessment is a certain percentage of the fair market value that is determined by local assessors to be the total taxable value of land and additions on the property. | Land | Improvement |
|---|---|---|---|---|
| 2025 | $637 | $7,900 | -- | -- |
| 2024 | $626 | $7,900 | -- | -- |
| 2023 | $626 | $7,900 | $1,580 | $6,320 |
| 2022 | $624 | $7,900 | $1,580 | $6,320 |
| 2021 | $677 | $16,170 | $3,230 | $12,940 |
| 2020 | $692 | $14,470 | $2,890 | $11,580 |
| 2019 | $713 | $13,360 | $2,670 | $10,690 |
| 2018 | $722 | $7,900 | $1,580 | $6,320 |
| 2017 | $732 | $7,900 | $1,580 | $6,320 |
| 2016 | $718 | $7,900 | $1,580 | $6,320 |
| 2015 | $702 | $7,900 | $1,580 | $6,320 |
Source: Public Records
Map
Nearby Homes
- 18001 N 99th Dr
- 9881 W Spanish Moss Ct
- 9874 W Highwood Ct
- 18211 N Conestoga Dr
- 18402 N Conestoga Dr
- 18018 N Highwood Ct
- 18417 N 99th Dr
- 9870 W Comstock Ct
- 17812 N Del Webb Blvd
- 17844 N 102nd Dr
- 17639 N 99th Dr
- 17651 N 99th Dr
- 17611 N 102nd Dr Unit 41
- 17603 N 99th Dr
- 10318 W Manzanita Dr
- 17447 N 99th Dr
- 17634 N 102nd Dr
- 9735 W Country Club Dr
- 9827 W Lindgren Ave
- 18410 N 104th Ave
- 18205 N 99th Dr
- 18029 N 99th Dr
- 18025 N 99th Dr
- 18209 N 99th Dr
- 18206 N 99th Dr
- 18213 N 99th Dr
- 18030 N 99th Dr
- 18021 N 99th Dr
- 18026 N 99th Dr
- 18210 N 99th Dr
- 18022 N 99th Dr Unit 6
- 18217 N 99th Dr
- 18017 N 99th Dr
- 18214 N 99th Dr
- 18018 N 99th Dr
- 18221 N 99th Dr
- 18218 N 99th Dr
- 18013 N 99th Dr
- 9875 W Willowbrook Ct Unit 56
- 18222 N 99th Dr Unit 46