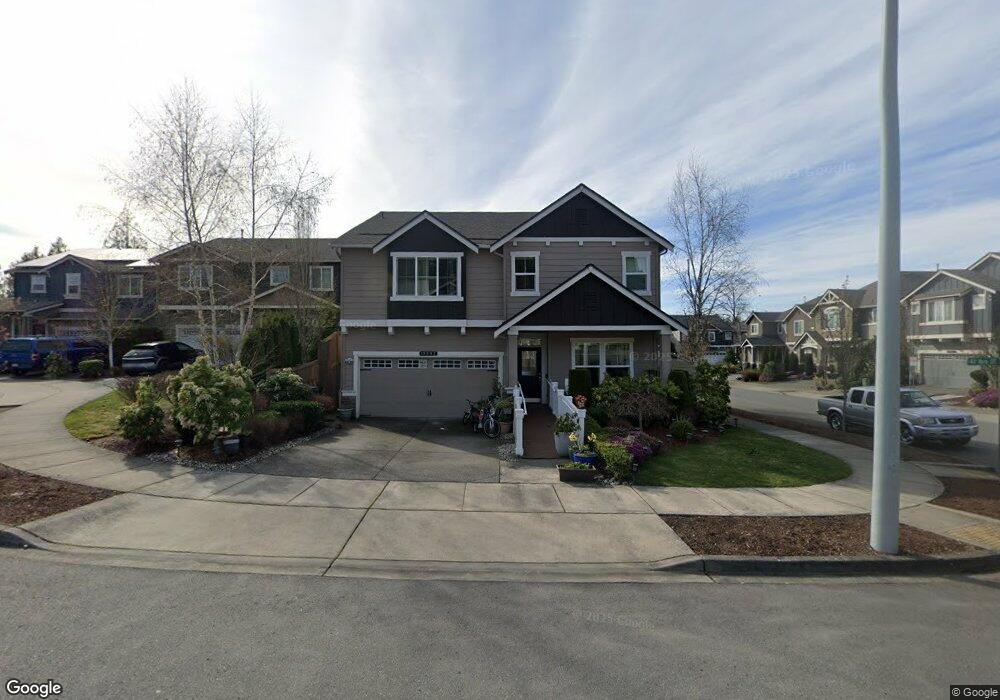
18202 41st Ave SE Bothell, WA 98012
North Creek NeighborhoodEstimated Value: $1,347,000 - $1,479,000
5
Beds
3
Baths
2,963
Sq Ft
$476/Sq Ft
Est. Value
About This Home
This home is located at 18202 41st Ave SE, Bothell, WA 98012 and is currently estimated at $1,409,359, approximately $475 per square foot. 18202 41st Ave SE is a home with nearby schools including Ruby Bridges Elementary School, Skyview Middle School, and North Creek High School.
Ownership History
Date
Name
Owned For
Owner Type
Purchase Details
Closed on
Feb 24, 2020
Sold by
Martin Rosheila Carandang
Bought by
Martin Rosheila Carandang and Martin Peter D
Current Estimated Value
Home Financials for this Owner
Home Financials are based on the most recent Mortgage that was taken out on this home.
Original Mortgage
$414,000
Outstanding Balance
$362,632
Interest Rate
3.6%
Mortgage Type
New Conventional
Estimated Equity
$1,046,727
Purchase Details
Closed on
Jun 10, 2014
Sold by
Martin Peter Daniel
Bought by
Martin Roshella Carandang
Home Financials for this Owner
Home Financials are based on the most recent Mortgage that was taken out on this home.
Original Mortgage
$445,980
Interest Rate
4.25%
Mortgage Type
New Conventional
Purchase Details
Closed on
Jun 3, 2014
Sold by
Sshi Llc
Bought by
Martin Rosheila Carandang and Carandang Roberto C
Home Financials for this Owner
Home Financials are based on the most recent Mortgage that was taken out on this home.
Original Mortgage
$445,980
Interest Rate
4.25%
Mortgage Type
New Conventional
Create a Home Valuation Report for This Property
The Home Valuation Report is an in-depth analysis detailing your home's value as well as a comparison with similar homes in the area
Home Values in the Area
Average Home Value in this Area
Purchase History
| Date | Buyer | Sale Price | Title Company |
|---|---|---|---|
| Martin Rosheila Carandang | -- | First American Title | |
| Martin Rosheila Carandang | $200,636 | First American Title | |
| Martin Roshella Carandang | -- | Chicago Title Company | |
| Martin Rosheila Carandang | $557,475 | Chicago Title |
Source: Public Records
Mortgage History
| Date | Status | Borrower | Loan Amount |
|---|---|---|---|
| Open | Martin Rosheila Carandang | $414,000 | |
| Previous Owner | Martin Rosheila Carandang | $445,980 |
Source: Public Records
Tax History
| Year | Tax Paid | Tax Assessment Tax Assessment Total Assessment is a certain percentage of the fair market value that is determined by local assessors to be the total taxable value of land and additions on the property. | Land | Improvement |
|---|---|---|---|---|
| 2026 | $10,455 | $1,352,700 | $875,500 | $477,200 |
| 2025 | $9,583 | $1,190,500 | $726,200 | $464,300 |
| 2024 | $9,583 | $1,091,300 | $637,600 | $453,700 |
| 2023 | $9,855 | $1,252,800 | $729,300 | $523,500 |
| 2022 | $8,416 | $848,800 | $438,600 | $410,200 |
| 2020 | $8,160 | $777,500 | $397,000 | $380,500 |
| 2019 | $7,123 | $686,800 | $310,000 | $376,800 |
| 2018 | $6,694 | $601,200 | $265,000 | $336,200 |
| 2017 | $6,069 | $556,400 | $215,000 | $341,400 |
| 2016 | $6,043 | $528,800 | $195,000 | $333,800 |
| 2015 | $6,167 | $513,500 | $182,000 | $331,500 |
Source: Public Records
Map
Nearby Homes
- 18214 41st Ave SE
- 17817 41st Dr SE
- 3933 178th Place SE
- 17913 38th Dr SE Unit 20
- 4117 177th Place SE
- 3918 177th St SE
- 4319 186th Place SE
- 4329 186th Place SE
- 18616 45th Dr SE
- 18521 46th Ave SE
- 18717 43rd Dr SE
- 18726 43rd Dr SE
- 18615 46th Ave SE
- 18115 34th Dr SE
- 17321 40th Ave SE
- 18725 35th Dr SE
- 3414 176th Place SE
- 18612 51st Ave SE
- 3205 179th Place SE
- 18223 31st Ave SE
- 18204 41st Ave SE
- 18204 41st Ave SE
- 18210 41st Ave SE
- 4025 181st Place SE
- 4029 181st Place SE
- 4025 181st Place SE
- 4031 181st Place SE
- 4021 181st Place SE
- 18201 41st Ave SE
- 18207 41st Ave SE
- 4107 181st Place SE
- 4107 181st Place SE
- 4023 183rd Place SE
- 4015 183rd Place SE
- 4023 183rd Place SE
- 4015 183rd Place SE Unit 6
- 4129 181st Place SE
- 4129 181st Place SE Unit 43
- 4031 183rd Place SE
Your Personal Tour Guide
Ask me questions while you tour the home.