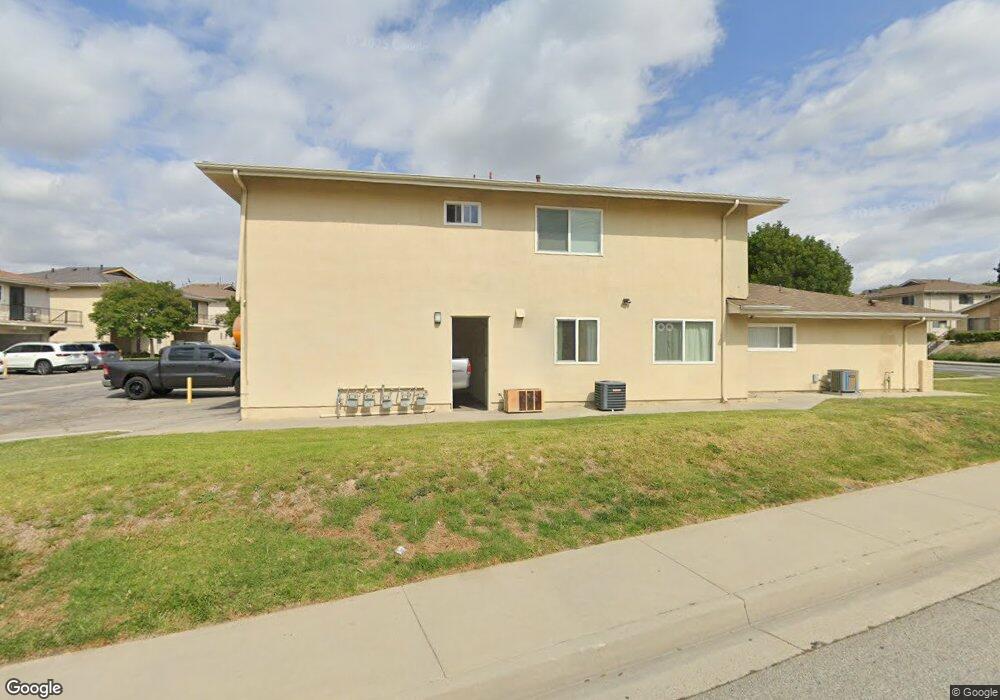
18205 Via Calma Unit 4 Rowland Heights, CA 91748
Estimated Value: $409,000 - $432,000
2
Beds
1
Bath
771
Sq Ft
$547/Sq Ft
Est. Value
About This Home
This home is located at 18205 Via Calma Unit 4, Rowland Heights, CA 91748 and is currently estimated at $422,095, approximately $547 per square foot. 18205 Via Calma Unit 4 is a home located in Los Angeles County with nearby schools including Rowland Elementary School, Alvarado Intermediate School, and John A. Rowland High School.
Ownership History
Date
Name
Owned For
Owner Type
Purchase Details
Closed on
Dec 16, 2014
Sold by
Shen William Shu Lin and Shen Clara Tsi Lean
Bought by
S & K Family Llc
Current Estimated Value
Purchase Details
Closed on
Apr 6, 2006
Sold by
Shen Shu Lin and Shen Clara Tsi Lean
Bought by
Shen William Shu Lin and Shen Clara Tsi Lean
Purchase Details
Closed on
Jan 16, 2002
Sold by
Patel Rakesh and Patel Bhagvati
Bought by
Shen Shu Lin and Shen Clara Tsi Lean
Home Financials for this Owner
Home Financials are based on the most recent Mortgage that was taken out on this home.
Original Mortgage
$75,000
Interest Rate
6.99%
Purchase Details
Closed on
Jan 25, 1999
Sold by
Patel Rakesh and Patel Bhagvati
Bought by
Patel Rakesh and Patel Bhagvati
Home Financials for this Owner
Home Financials are based on the most recent Mortgage that was taken out on this home.
Original Mortgage
$82,780
Interest Rate
6.78%
Mortgage Type
FHA
Create a Home Valuation Report for This Property
The Home Valuation Report is an in-depth analysis detailing your home's value as well as a comparison with similar homes in the area
Home Values in the Area
Average Home Value in this Area
Purchase History
| Date | Buyer | Sale Price | Title Company |
|---|---|---|---|
| S & K Family Llc | -- | None Available | |
| Shen William Shu Lin | -- | Accommodation | |
| Shen Shu Lin | $107,500 | Chicago Title | |
| Patel Rakesh | -- | Southland Title Corporation |
Source: Public Records
Mortgage History
| Date | Status | Borrower | Loan Amount |
|---|---|---|---|
| Previous Owner | Shen Shu Lin | $75,000 | |
| Previous Owner | Patel Rakesh | $82,780 |
Source: Public Records
Tax History Compared to Growth
Tax History
| Year | Tax Paid | Tax Assessment Tax Assessment Total Assessment is a certain percentage of the fair market value that is determined by local assessors to be the total taxable value of land and additions on the property. | Land | Improvement |
|---|---|---|---|---|
| 2025 | $2,311 | $158,786 | $53,465 | $105,321 |
| 2024 | $2,311 | $155,673 | $52,417 | $103,256 |
| 2023 | $2,240 | $152,622 | $51,390 | $101,232 |
| 2022 | $2,189 | $149,631 | $50,383 | $99,248 |
| 2021 | $2,150 | $146,698 | $49,396 | $97,302 |
| 2019 | $2,088 | $142,349 | $47,932 | $94,417 |
| 2018 | $1,990 | $139,559 | $46,993 | $92,566 |
| 2016 | $1,910 | $134,141 | $45,169 | $88,972 |
| 2015 | $1,881 | $132,127 | $44,491 | $87,636 |
| 2014 | $1,881 | $129,540 | $43,620 | $85,920 |
Source: Public Records
Map
Nearby Homes
- 1912 Tomas Ct
- 18186 Rio Seco Dr
- 1808 Via Entrada
- 1902 Jellick Ave
- 2010 La Cueva Dr
- 18239 Villa Clara St
- 2474 Patrician View Ave
- 17834 Calle Los Arboles
- 1971 Via Tranquilo
- 18220 Gallineta St
- 2362 Cuatro Dr
- 2330 Donosa Dr
- 18716 Greengate St
- 2306 Doubletree Ln
- 18620 Mescalero St
- 2426 Batson Ave
- 2453 Fullerton Rd
- 18557 Mescal St
- 17812 Gallineta St
- 18536 Mescal St
- 18205 Via Calma Unit 3
- 18205 Via Calma Unit 2
- 18205 Via Calma Unit 1
- 18211 Via Calma Unit 4
- 18211 Via Calma Unit 3
- 18211 Via Calma Unit 2
- 18211 Via Calma Unit 1
- 18201 Via Calma Unit 4
- 18201 Via Calma Unit 3
- 18201 Via Calma Unit 2
- 18201 Via Calma Unit 1
- 18124 Camino Bello Unit 1
- 18124 Camino Bello Unit 2
- 18124 Camino Bello Unit 4
- 18124 Camino Bello Unit 3
- 18124 Camino Bello Unit 2
- 18217 Via Calma Unit 4
- 18217 Via Calma Unit 3
- 18217 Via Calma Unit 2
- 18217 Via Calma Unit 1