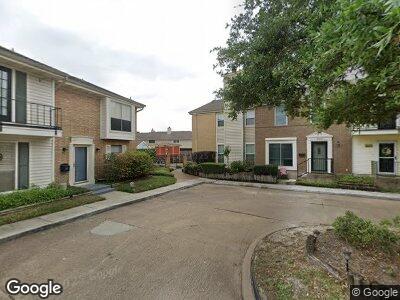
18206 Vinland Dr Unit 8206 Houston, TX 77058
Estimated Value: $153,000 - $185,000
2
Beds
3
Baths
1,280
Sq Ft
$131/Sq Ft
Est. Value
About This Home
This home is located at 18206 Vinland Dr Unit 8206, Houston, TX 77058 and is currently estimated at $168,053, approximately $131 per square foot. 18206 Vinland Dr Unit 8206 is a home located in Harris County with nearby schools including G.W. Robinson Elementary, Space Center Intermediate, and Clear Creek High School.
Ownership History
Date
Name
Owned For
Owner Type
Purchase Details
Closed on
Jul 20, 2018
Sold by
Montgomery Jeffrey Matthew and Montgomery Elizabeth Corona
Bought by
Garcia Jacqueline
Current Estimated Value
Home Financials for this Owner
Home Financials are based on the most recent Mortgage that was taken out on this home.
Original Mortgage
$101,600
Outstanding Balance
$89,145
Interest Rate
4.5%
Mortgage Type
New Conventional
Estimated Equity
$78,908
Purchase Details
Closed on
Oct 9, 2014
Sold by
Nelson George C and Nelson Rosalynn Fay Besmio
Bought by
Montgomery Jeffrey Matthew and Montgomery Eliabeth Corona
Home Financials for this Owner
Home Financials are based on the most recent Mortgage that was taken out on this home.
Original Mortgage
$63,000
Interest Rate
4.13%
Mortgage Type
New Conventional
Purchase Details
Closed on
Oct 25, 2002
Sold by
Abouleish Ezzat I and Abouleish Atiya S
Bought by
Nelson George C
Home Financials for this Owner
Home Financials are based on the most recent Mortgage that was taken out on this home.
Original Mortgage
$76,000
Interest Rate
6.01%
Create a Home Valuation Report for This Property
The Home Valuation Report is an in-depth analysis detailing your home's value as well as a comparison with similar homes in the area
Home Values in the Area
Average Home Value in this Area
Purchase History
| Date | Buyer | Sale Price | Title Company |
|---|---|---|---|
| Garcia Jacqueline | -- | None Available | |
| Montgomery Jeffrey Matthew | -- | Great American Title Co | |
| Nelson George C | -- | Chicago Title |
Source: Public Records
Mortgage History
| Date | Status | Borrower | Loan Amount |
|---|---|---|---|
| Open | Garcia Jacqueline | $101,600 | |
| Previous Owner | Montgomery Jeffrey Matthew | $63,000 | |
| Previous Owner | Nelson George C | $60,000 | |
| Previous Owner | Nelson George C | $76,000 |
Source: Public Records
Tax History Compared to Growth
Tax History
| Year | Tax Paid | Tax Assessment Tax Assessment Total Assessment is a certain percentage of the fair market value that is determined by local assessors to be the total taxable value of land and additions on the property. | Land | Improvement |
|---|---|---|---|---|
| 2023 | $2,600 | $182,177 | $34,614 | $147,563 |
| 2022 | $3,426 | $168,461 | $32,008 | $136,453 |
| 2021 | $3,371 | $135,482 | $25,742 | $109,740 |
| 2020 | $3,509 | $131,973 | $25,075 | $106,898 |
| 2019 | $3,484 | $125,445 | $23,835 | $101,610 |
| 2018 | $1,458 | $105,856 | $20,113 | $85,743 |
| 2017 | $2,858 | $102,903 | $19,552 | $83,351 |
| 2016 | $2,654 | $95,553 | $18,155 | $77,398 |
| 2015 | $2,222 | $80,000 | $15,200 | $64,800 |
| 2014 | $2,222 | $80,000 | $15,200 | $64,800 |
Source: Public Records
Map
Nearby Homes
- 1610 San Sebastian Ln
- 18202 Vinland Dr Unit 8202
- 1812 Saxony Ln
- 18210 Point Lookout Dr
- 18215 Hereford Ln
- 18230 Hereford Ln
- 18435 Point Lookout Dr
- 18615 Martinique Dr
- 18531 Point Lookout Dr
- 18614 Prince William Ln
- 18611 Cape Charles Ln
- 1410 Saxony Ln
- 18330 Cape Bahamas Ln
- 1330 Saxony Ln
- 18230 Caprice Ln
- 18602 Carriage Ct
- 18618 Point Lookout Dr
- 18639 Prince William Ln
- 18210 Caprice Ln
- 18658 Martinique Dr
- 1711 San Sebastian Ln Unit 1711
- 18102 Heritage Ln Unit 8102
- 1713 San Sebastian Ln Unit 1713
- 1607 San Sebastian Ln Unit 1607
- 18100 Heritage Ln Unit 8100
- 18113 Heritage Ln Unit 8113
- 18109 Heritage Ln Unit 1
- 18112 Heritage Ln Unit 8112
- 1611 San Sebastian Ln Unit 1611
- 1615 San Sebastian Ln Unit 1615
- 1705 San Sebastian Ln Unit 1705
- 18210 Heritage Ln Unit 8210
- 18202 Heritage Ln Unit 8202
- 1709 San Sebastian Ln Unit 5
- 18206 Vinland Dr Unit 8206
- 18206 Heritage Ln Unit 8206
- 18214 Vinland Dr Unit 8214
- 18214 Heritage Ln Unit 8214
- 18218 Vinland Dr Unit 8218
- 1707 San Sebastian Ln Unit 1707