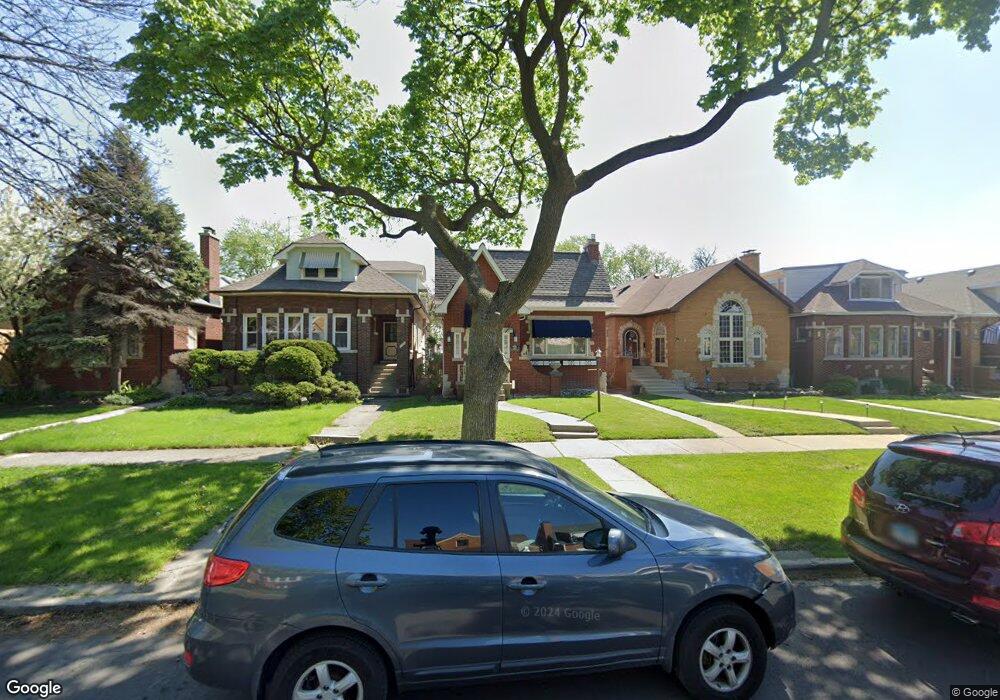
1821 N Natchez Ave Chicago, IL 60707
Galewood NeighborhoodEstimated Value: $368,664 - $408,000
4
Beds
3
Baths
1,255
Sq Ft
$304/Sq Ft
Est. Value
About This Home
This home is located at 1821 N Natchez Ave, Chicago, IL 60707 and is currently estimated at $381,666, approximately $304 per square foot. 1821 N Natchez Ave is a home located in Cook County with nearby schools including Lovett Elementary School, Steinmetz College Prep, and Acero - Roberto Clemente Elementary School.
Ownership History
Date
Name
Owned For
Owner Type
Purchase Details
Closed on
Nov 18, 2011
Sold by
Wimberly Andre and Wimberly Kim
Bought by
Wimberly Andre
Current Estimated Value
Purchase Details
Closed on
Oct 20, 2004
Sold by
Anderson Mona L and Anderson Natreece S
Bought by
Wimberly Andre and Wimberly Kim
Home Financials for this Owner
Home Financials are based on the most recent Mortgage that was taken out on this home.
Original Mortgage
$280,250
Outstanding Balance
$167,503
Interest Rate
9%
Mortgage Type
Stand Alone First
Estimated Equity
$214,163
Purchase Details
Closed on
Aug 24, 2001
Sold by
Derusha Alan L
Bought by
Anderson Mona L and Anderson Natreece S
Home Financials for this Owner
Home Financials are based on the most recent Mortgage that was taken out on this home.
Original Mortgage
$184,550
Interest Rate
7.11%
Mortgage Type
FHA
Purchase Details
Closed on
Apr 2, 2001
Sold by
Haywood Willie and Toussaint Mary G
Bought by
Derusha Alan
Create a Home Valuation Report for This Property
The Home Valuation Report is an in-depth analysis detailing your home's value as well as a comparison with similar homes in the area
Home Values in the Area
Average Home Value in this Area
Purchase History
| Date | Buyer | Sale Price | Title Company |
|---|---|---|---|
| Wimberly Andre | -- | None Available | |
| Wimberly Andre | $295,000 | Cst | |
| Anderson Mona L | $187,500 | Chicago Title Insurance Co | |
| Derusha Alan | -- | Chicago Title Insurance Co |
Source: Public Records
Mortgage History
| Date | Status | Borrower | Loan Amount |
|---|---|---|---|
| Open | Wimberly Andre | $280,250 | |
| Previous Owner | Anderson Mona L | $184,550 |
Source: Public Records
Tax History Compared to Growth
Tax History
| Year | Tax Paid | Tax Assessment Tax Assessment Total Assessment is a certain percentage of the fair market value that is determined by local assessors to be the total taxable value of land and additions on the property. | Land | Improvement |
|---|---|---|---|---|
| 2024 | $3,944 | $29,000 | $15,497 | $13,503 |
| 2023 | $3,823 | $22,000 | $11,273 | $10,727 |
| 2022 | $3,823 | $22,000 | $11,273 | $10,727 |
| 2021 | $3,756 | $21,999 | $11,272 | $10,727 |
| 2020 | $4,830 | $24,772 | $6,487 | $18,285 |
| 2019 | $4,906 | $27,834 | $6,487 | $21,347 |
| 2018 | $4,822 | $27,834 | $6,487 | $21,347 |
| 2017 | $4,586 | $24,668 | $5,709 | $18,959 |
| 2016 | $4,443 | $24,668 | $5,709 | $18,959 |
| 2015 | $4,042 | $24,668 | $5,709 | $18,959 |
| 2014 | $3,734 | $22,681 | $5,190 | $17,491 |
| 2013 | $3,650 | $22,681 | $5,190 | $17,491 |
Source: Public Records
Map
Nearby Homes
- 1700 N Natoma Ave
- 1627 N Narragansett Ave
- 1639 N Normandy Ave
- 1937 N Normandy Ave
- 1733 N Oak Park Ave
- 1227 N East Ave
- 1221 Edmer Ave
- 1212 N Harvey Ave
- 1104 Fair Oaks Ave
- 1122 N Ridgeland Ave
- 1221 Hayes Ave
- 1701 N Newland Ave
- 1715 N Meade Ave
- 1600 N New England Ave Unit 4
- 1130 N Grove Ave
- 102 Le Moyne Pkwy
- 1618 N Mcvicker Ave
- 2311 N Natchez Ave
- 1625 N Mcvicker Ave
- 34 Le Moyne Pkwy
- 1819 N Natchez Ave
- 1815 N Natchez Ave
- 1825 N Natchez Ave
- 1811 N Natchez Ave
- 1827 N Natchez Ave
- 1809 N Natchez Ave
- 1831 N Natchez Ave
- 1807 N Natchez Ave
- 1833 N Natchez Ave
- 1803 N Natchez Ave
- 6466 W Bloomingdale Ave
- 1837 N Natchez Ave
- 1801 N Natchez Ave
- 1818 N Nagle Ave
- 1820 N Nagle Ave
- 1814 N Nagle Ave
- 1812 N Nagle Ave
- 1824 N Nagle Ave
- 6458 W Bloomingdale Ave
- 1839 N Natchez Ave