
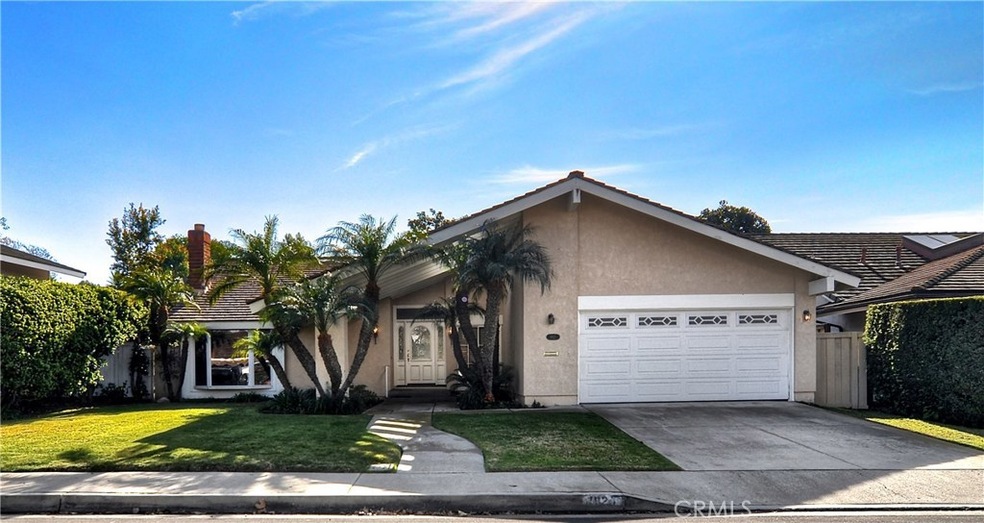
1821 Port Seabourne Way Newport Beach, CA 92660
Harbor View Homes Neighborhood
4
Beds
2
Baths
1,816
Sq Ft
8,000
Sq Ft Lot
Highlights
- High Ceiling
- Neighborhood Views
- Outdoor Cooking Area
- Corona del Mar Middle and High School Rated A
- Community Pool
- 2 Car Direct Access Garage
About This Home
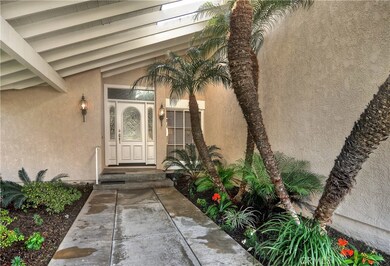
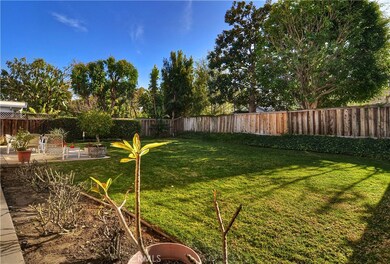
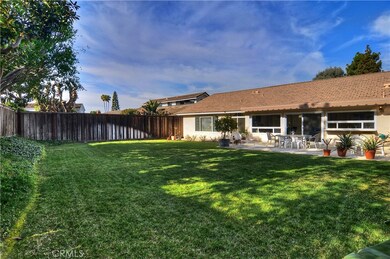
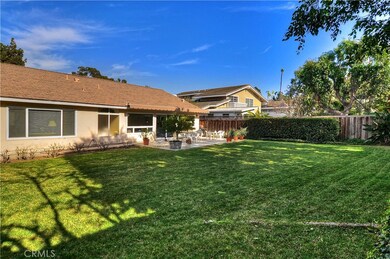
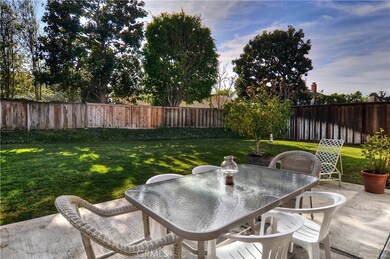
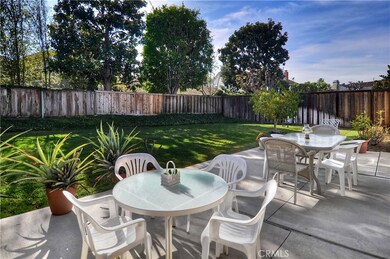
As of April 2025This Port Streets home was built on a huge lot of 8000 sq ft, prime for a complete remodel or a stunning rebuild. With vaulted ceilings throughout and a huge yard for entertaining or for adding a pool, this home is ready for someones personal touch. Situated walking distance to one of the best schools in Newport Beach, Roy O. Anderson Elementary School, this home location is perfect for a family or someone looking to get in to the Port Streets market at an amazing value. The Community members enjoy use of a beautiful clubhouse built in 2004, a 8 lane lap pool, a wade pool, City park and pathways, youth swim team, youth water polo, private and semi-private swim lessons and many other community organized events. The association also offers on-site management.
Co-Listed By
Lisa Casey
Lisa Casey, Broker License #01707849
Home Details
Home Type
- Single Family
Est. Annual Taxes
- $27,225
Year Built
- Built in 1970
Lot Details
- 8,000 Sq Ft Lot
- Density is up to 1 Unit/Acre
HOA Fees
- $115 Monthly HOA Fees
Parking
- 2 Car Direct Access Garage
- Parking Available
- Driveway
Interior Spaces
- 1,816 Sq Ft Home
- 1-Story Property
- High Ceiling
- Awning
- Family Room with Fireplace
- Neighborhood Views
Bedrooms and Bathrooms
- 4 Main Level Bedrooms
- 2 Full Bathrooms
- Bathtub
Laundry
- Laundry Room
- Laundry in Garage
Outdoor Features
- Patio
- Exterior Lighting
- Rain Gutters
Schools
- Anderson Elementary School
- Corona Del Mar High School
Utilities
- Forced Air Heating System
Listing and Financial Details
- Tax Lot 16
- Tax Tract Number 7027
- Assessor Parcel Number 45824303
Community Details
Overview
- Newport Hills Community Association, Phone Number (949) 721-1929
Amenities
- Outdoor Cooking Area
- Community Barbecue Grill
- Picnic Area
Recreation
- Community Playground
- Community Pool
Ownership History
Date
Name
Owned For
Owner Type
Purchase Details
Listed on
Mar 21, 2025
Closed on
Apr 2, 2025
Sold by
Pakatchian Family Trust Survivors Trust and Pakatchian Amin
Bought by
Feiner Family Trust and Feiner
Seller's Agent
Julianne Pierzak
Coldwell Banker Realty
Buyer's Agent
Julianne Pierzak
Coldwell Banker Realty
List Price
$7,795,000
Sold Price
$7,500,000
Premium/Discount to List
-$295,000
-3.78%
Views
34
Current Estimated Value
Home Financials for this Owner
Home Financials are based on the most recent Mortgage that was taken out on this home.
Estimated Appreciation
-$303,305
Avg. Annual Appreciation
-11.76%
Original Mortgage
$1,500,000
Outstanding Balance
$1,494,911
Interest Rate
6.87%
Mortgage Type
New Conventional
Estimated Equity
$5,701,784
Purchase Details
Listed on
Mar 21, 2025
Closed on
Mar 26, 2025
Sold by
Jeronimo Jessica Adela Alexis
Bought by
Pakatchian Amin
Seller's Agent
Julianne Pierzak
Coldwell Banker Realty
Buyer's Agent
Julianne Pierzak
Coldwell Banker Realty
List Price
$7,795,000
Sold Price
$7,500,000
Premium/Discount to List
-$295,000
-3.78%
Views
34
Home Financials for this Owner
Home Financials are based on the most recent Mortgage that was taken out on this home.
Original Mortgage
$1,500,000
Outstanding Balance
$1,494,911
Interest Rate
6.87%
Mortgage Type
New Conventional
Estimated Equity
$5,701,784
Purchase Details
Listed on
Mar 21, 2025
Closed on
Mar 25, 2025
Sold by
Pakatchian Amin
Bought by
Pakatchian Family Trust and Pakatchian
Seller's Agent
Julianne Pierzak
Coldwell Banker Realty
Buyer's Agent
Julianne Pierzak
Coldwell Banker Realty
List Price
$7,795,000
Sold Price
$7,500,000
Premium/Discount to List
-$295,000
-3.78%
Views
34
Home Financials for this Owner
Home Financials are based on the most recent Mortgage that was taken out on this home.
Original Mortgage
$1,500,000
Outstanding Balance
$1,494,911
Interest Rate
6.87%
Mortgage Type
New Conventional
Estimated Equity
$5,701,784
Purchase Details
Listed on
Mar 28, 2022
Closed on
Aug 24, 2022
Sold by
Dra Family Trust
Bought by
Pakatchian Family Trust
Seller's Agent
Dustin Sweeter
Keller Williams Realty
Buyer's Agent
Matthew Smith
Realty Masters & Associates
List Price
$2,850,000
Sold Price
$2,500,000
Premium/Discount to List
-$350,000
-12.28%
Views
7
Home Financials for this Owner
Home Financials are based on the most recent Mortgage that was taken out on this home.
Avg. Annual Appreciation
52.09%
Original Mortgage
$1,100,000
Interest Rate
5.38%
Mortgage Type
New Conventional
Purchase Details
Listed on
Jul 31, 2020
Closed on
Jul 27, 2020
Sold by
Rodriguez Daver
Bought by
Alvarez Daver Rodriguez and The Dra Family Trust
Seller's Agent
Greg Nowling
Partners Real Estate Group
Buyer's Agent
Katie Bethel-Drown
Surterre Properties Inc.
Sold Price
$5,000
Purchase Details
Listed on
Mar 26, 2019
Closed on
Mar 15, 2019
Sold by
Nunez Carol
Bought by
Rodriguez Daver
Seller's Agent
Greg Nowling
Partners Real Estate Group
Buyer's Agent
Ramzi Ataya
Engel & Völkers Newport Beach
Sold Price
$5,000
Home Financials for this Owner
Home Financials are based on the most recent Mortgage that was taken out on this home.
Avg. Annual Appreciation
24.06%
Original Mortgage
$1,346,250
Interest Rate
4.4%
Mortgage Type
New Conventional
Purchase Details
Listed on
Jan 30, 2019
Closed on
Feb 8, 2019
Sold by
Cummings Deborah Ann
Bought by
Rodriguez Daver
Seller's Agent
Sean Casey
Roof Real Estate
Buyer's Agent
Dustin Sweeter
Keller Williams Realty
List Price
$1,795,000
Sold Price
$1,795,000
Home Financials for this Owner
Home Financials are based on the most recent Mortgage that was taken out on this home.
Original Mortgage
$1,346,250
Interest Rate
4.4%
Mortgage Type
New Conventional
Purchase Details
Closed on
Mar 8, 1995
Sold by
Cullen Joseph Francis and Cullen Audrey Kathryn
Bought by
Cullen Joseph Francis and Cullen Audrey Kathryn
Similar Homes in the area
Create a Home Valuation Report for This Property
The Home Valuation Report is an in-depth analysis detailing your home's value as well as a comparison with similar homes in the area
Home Values in the Area
Average Home Value in this Area
Purchase History
| Date | Type | Sale Price | Title Company |
|---|---|---|---|
| Grant Deed | $7,500,000 | Equity Title Company | |
| Quit Claim Deed | -- | Chicago Title Company | |
| Grant Deed | -- | Chicago Title Company | |
| Grant Deed | -- | Chicago Title Company | |
| Grant Deed | $2,500,000 | Usa National Title | |
| Interfamily Deed Transfer | -- | None Available | |
| Interfamily Deed Transfer | -- | Lawyers Title Company | |
| Grant Deed | $1,795,000 | Lawyers Title Company | |
| Interfamily Deed Transfer | -- | -- |
Source: Public Records
Mortgage History
| Date | Status | Loan Amount | Loan Type |
|---|---|---|---|
| Open | $1,500,000 | New Conventional | |
| Previous Owner | $1,855,000 | New Conventional | |
| Previous Owner | $1,100,000 | New Conventional | |
| Previous Owner | $1,398,500 | Adjustable Rate Mortgage/ARM | |
| Previous Owner | $1,346,250 | New Conventional |
Source: Public Records
Property History
| Date | Event | Price | Change | Sq Ft Price |
|---|---|---|---|---|
| 04/28/2025 04/28/25 | Sold | $7,500,000 | -3.8% | $1,615 / Sq Ft |
| 03/25/2025 03/25/25 | Pending | -- | -- | -- |
| 03/21/2025 03/21/25 | For Sale | $7,795,000 | +211.8% | $1,679 / Sq Ft |
| 09/16/2022 09/16/22 | Sold | $2,500,000 | -3.8% | $1,377 / Sq Ft |
| 08/15/2022 08/15/22 | Pending | -- | -- | -- |
| 08/08/2022 08/08/22 | Price Changed | $2,600,000 | -3.7% | $1,432 / Sq Ft |
| 07/01/2022 07/01/22 | Price Changed | $2,700,000 | -1.8% | $1,487 / Sq Ft |
| 06/20/2022 06/20/22 | Price Changed | $2,750,000 | -3.5% | $1,514 / Sq Ft |
| 06/10/2022 06/10/22 | For Sale | $2,850,000 | 0.0% | $1,569 / Sq Ft |
| 05/06/2022 05/06/22 | Pending | -- | -- | -- |
| 04/28/2022 04/28/22 | For Sale | $2,850,000 | 0.0% | $1,569 / Sq Ft |
| 04/18/2022 04/18/22 | Pending | -- | -- | -- |
| 04/13/2022 04/13/22 | For Sale | $2,850,000 | 0.0% | $1,569 / Sq Ft |
| 04/09/2022 04/09/22 | Pending | -- | -- | -- |
| 03/28/2022 03/28/22 | For Sale | $2,850,000 | 0.0% | $1,569 / Sq Ft |
| 08/26/2020 08/26/20 | Rented | $5,000 | 0.0% | -- |
| 08/25/2020 08/25/20 | Under Contract | -- | -- | -- |
| 08/20/2020 08/20/20 | Price Changed | $5,000 | -4.6% | $3 / Sq Ft |
| 07/31/2020 07/31/20 | For Rent | $5,240 | +4.8% | -- |
| 05/13/2019 05/13/19 | Rented | $5,000 | 0.0% | -- |
| 04/30/2019 04/30/19 | Under Contract | -- | -- | -- |
| 04/12/2019 04/12/19 | Price Changed | $5,000 | +11.1% | $3 / Sq Ft |
| 04/04/2019 04/04/19 | Price Changed | $4,500 | -30.8% | $2 / Sq Ft |
| 03/26/2019 03/26/19 | For Rent | $6,500 | 0.0% | -- |
| 03/19/2019 03/19/19 | Sold | $1,795,000 | 0.0% | $988 / Sq Ft |
| 02/04/2019 02/04/19 | Pending | -- | -- | -- |
| 01/30/2019 01/30/19 | For Sale | $1,795,000 | -- | $988 / Sq Ft |
Source: California Regional Multiple Listing Service (CRMLS)
Tax History Compared to Growth
Tax History
| Year | Tax Paid | Tax Assessment Tax Assessment Total Assessment is a certain percentage of the fair market value that is determined by local assessors to be the total taxable value of land and additions on the property. | Land | Improvement |
|---|---|---|---|---|
| 2025 | $27,225 | $3,636,930 | $2,466,416 | $1,170,514 |
| 2024 | $27,225 | $2,550,000 | $2,418,055 | $131,945 |
| 2023 | $26,588 | $2,500,000 | $2,370,642 | $129,358 |
| 2022 | $20,214 | $1,886,865 | $1,757,507 | $129,358 |
| 2021 | $19,827 | $1,849,868 | $1,723,046 | $126,822 |
| 2020 | $19,637 | $1,830,900 | $1,705,378 | $125,522 |
| 2019 | $1,676 | $132,185 | $59,198 | $72,987 |
| 2018 | $1,644 | $129,594 | $58,038 | $71,556 |
| 2017 | $1,615 | $127,053 | $56,900 | $70,153 |
| 2016 | $1,581 | $124,562 | $55,784 | $68,778 |
| 2015 | $1,563 | $122,691 | $54,946 | $67,745 |
| 2014 | $1,526 | $120,288 | $53,870 | $66,418 |
Source: Public Records
Agents Affiliated with this Home
-
Julianne Pierzak
Seller's Agent in 2025
Julianne Pierzak
Coldwell Banker Realty
(949) 244-4509
13 in this area
35 Total Sales
-
Dustin Sweeter
Seller's Agent in 2022
Dustin Sweeter
Keller Williams Realty
(951) 729-3340
1 in this area
268 Total Sales
-
Michael Killam
Seller Co-Listing Agent in 2022
Michael Killam
Keller Williams Realty
(951) 729-3340
1 in this area
213 Total Sales
-
M
Buyer's Agent in 2022
Matthew Smith
Realty Masters & Associates
-
Greg Nowling
G
Seller's Agent in 2020
Greg Nowling
Partners Real Estate Group
(714) 514-2201
11 Total Sales
-
Katie Bethel-Drown
Buyer's Agent in 2020
Katie Bethel-Drown
Surterre Properties Inc.
(949) 419-5386
6 in this area
22 Total Sales
Map
Source: California Regional Multiple Listing Service (CRMLS)
MLS Number: NP19021953
APN: 458-243-03
Disclaimer: Certain information contained herein is derived from information provided by parties other than Homes.com. All information provided is deemed reliable, but is not guaranteed to be accurate and should be independently verified.
![]() The multiple listing data appearing on this website, or contained in reports produced therefrom, is owned and copyrighted by California Regional Multiple Listing Service, Inc. ("CRMLS") and is protected by all applicable copyright laws. Information provided is for viewer's personal, non-commercial use and may not be used for any purpose other than to identify prospective properties the viewer may be interested in purchasing. All listing data, including but not limited to square footage and lot size is believed to be accurate, but the listing Agent, listing Broker and CRMLS and its affiliates do not warrant or guarantee such accuracy. The viewer should independently verify the listed data prior to making any decisions based on such information by personal inspection and/or contacting a real estate professional.
The multiple listing data appearing on this website, or contained in reports produced therefrom, is owned and copyrighted by California Regional Multiple Listing Service, Inc. ("CRMLS") and is protected by all applicable copyright laws. Information provided is for viewer's personal, non-commercial use and may not be used for any purpose other than to identify prospective properties the viewer may be interested in purchasing. All listing data, including but not limited to square footage and lot size is believed to be accurate, but the listing Agent, listing Broker and CRMLS and its affiliates do not warrant or guarantee such accuracy. The viewer should independently verify the listed data prior to making any decisions based on such information by personal inspection and/or contacting a real estate professional.
Based on information from California Regional Multiple Listing Service, Inc. and /or other sources. All data, including all measurements and calculations of area, is obtained from various sources and has not been, and will not be, verified by broker or MLS. All information should be independently reviewed and verified for accuracy. Properties may or may not be listed by the office/agent presenting the information
Nearby Homes
- 1963 Port Edward Place
- 5 Hillsborough
- 7 Belmont
- 29 Augusta Ln
- 1977 Port Cardiff Place
- 17 Monaco Unit 12
- 15 Cypress Point Ln
- 1707 Newport Hills Dr W
- 1736 Port Sheffield Place
- 9 Saint Tropez
- 3 Cypress Point Ln
- 56 Royal Saint George Rd
- 417 Bay Hill Dr
- 4 Summer House Ln
- 11 Montpellier Unit 22
- 1 Rue du Parc
- 515 Bay Hill Dr
- 2 Royal Saint George Rd
- 15 Boardwalk
- 31 Carmel Bay Dr