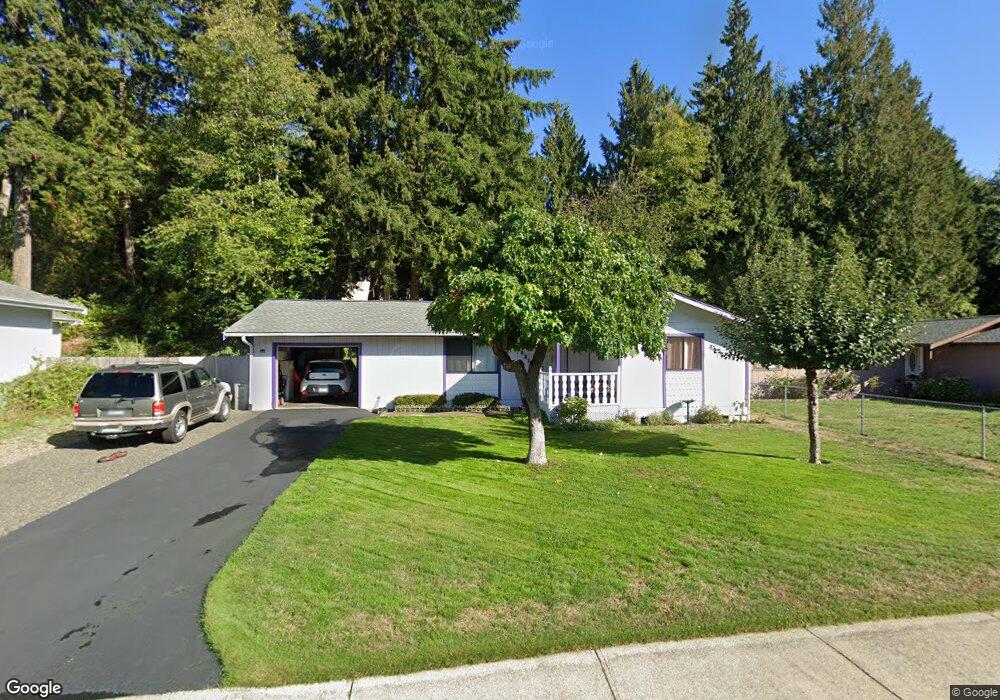
1821 Ricky Ct E Port Orchard, WA 98366
Manchester NeighborhoodEstimated Value: $387,000 - $412,000
3
Beds
1
Bath
1,052
Sq Ft
$378/Sq Ft
Est. Value
About This Home
This home is located at 1821 Ricky Ct E, Port Orchard, WA 98366 and is currently estimated at $397,761, approximately $378 per square foot. 1821 Ricky Ct E is a home located in Kitsap County with nearby schools including Manchester Elementary School, John Sedgwick Middle School, and South Kitsap High School.
Create a Home Valuation Report for This Property
The Home Valuation Report is an in-depth analysis detailing your home's value as well as a comparison with similar homes in the area
Home Values in the Area
Average Home Value in this Area
Tax History Compared to Growth
Tax History
| Year | Tax Paid | Tax Assessment Tax Assessment Total Assessment is a certain percentage of the fair market value that is determined by local assessors to be the total taxable value of land and additions on the property. | Land | Improvement |
|---|---|---|---|---|
| 2026 | $654 | $339,320 | $88,810 | $250,510 |
| 2025 | $654 | $339,320 | $88,810 | $250,510 |
| 2024 | $639 | $339,320 | $88,810 | $250,510 |
| 2023 | $608 | $339,320 | $88,810 | $250,510 |
| 2022 | $2,746 | $271,330 | $70,920 | $200,410 |
| 2021 | $2,532 | $236,490 | $61,670 | $174,820 |
| 2020 | $2,392 | $216,850 | $57,860 | $158,990 |
| 2019 | $2,061 | $205,050 | $54,690 | $150,360 |
| 2018 | $2,155 | $161,850 | $47,460 | $114,390 |
| 2017 | $1,794 | $161,850 | $47,460 | $114,390 |
| 2016 | $1,758 | $145,200 | $45,200 | $100,000 |
| 2015 | $1,699 | $142,320 | $45,200 | $97,120 |
| 2014 | -- | $136,850 | $45,810 | $91,040 |
| 2013 | -- | $136,850 | $45,810 | $91,040 |
Source: Public Records
Map
Nearby Homes
- 7166 E Fillmore St
- 802 California Ave SE
- 7104 SE Kansas St
- 1738 Lilypad Place E
- 7085 SE Legrand St
- 6521 SE Mile Hill Dr Unit 23
- 5957 E Collins Rd
- 7847 SE Monte Bella Place
- 1083 Puget Dr E
- 7549 E Alki View Ct
- 8009 E Commons Ct
- 7230 E Maple St
- 7748 E Hemlock St
- 1381 Alaska Ave SE
- 8151 E Seaview Dr
- 8185 E Seaview Dr
- 71 Carson Ave SE
- 1630 & 1632 Colchester Dr E
- 1313 Colchester Dr SE
- 1135 Hillandale Dr E
- 1827 Ricky Ct E
- 1815 Ricky Ct E
- 7047 E Firefly Ct
- 7041 E Firefly Ct
- 1833 Ricky Ct E
- 1809 Ricky Ct E
- 1820 Ricky Ct E
- 7053 E Firefly Ct
- 1814 Ricky Ct E
- 1826 Ricky Ct E
- 7035 E Firefly Ct
- 1803 Ricky Ct E
- 1839 Ricky Ct E
- 1808 Ricky Ct E
- 1140 Silverleaf Ct E
- 1150 Silverleaf Ct E
- 1832 Ricky Ct E
- 7033 E Polk Ave
- 1800 Ricky Ct E
- 7059 E Firefly Ct