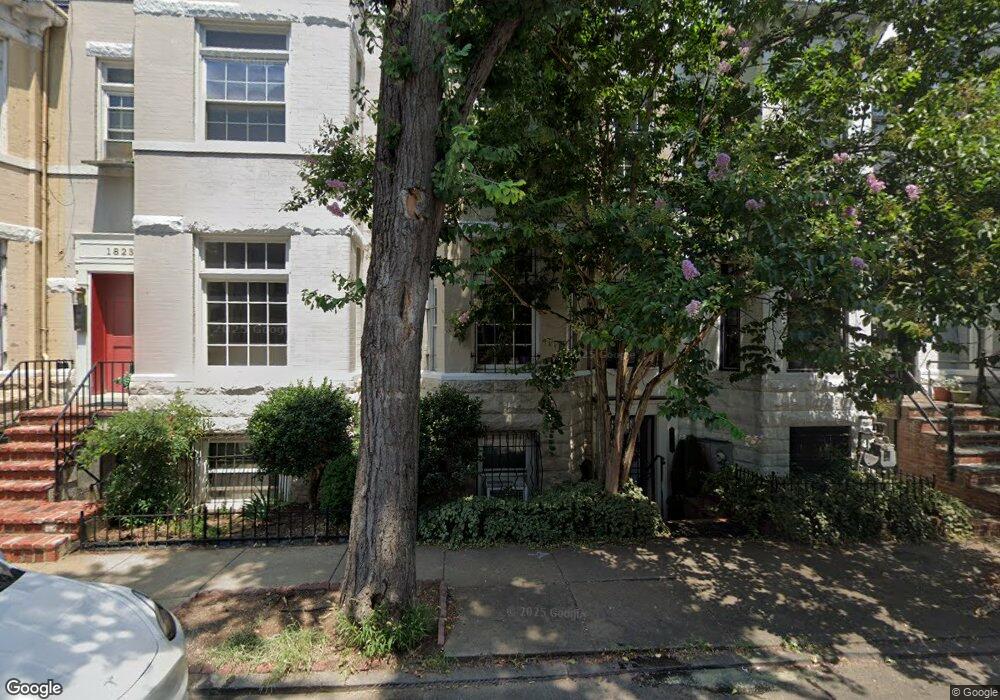
1821 Riggs Place NW Unit 1 Washington, DC 20009
Dupont Circle NeighborhoodEstimated Value: $547,000 - $563,000
2
Beds
1
Bath
859
Sq Ft
$643/Sq Ft
Est. Value
About This Home
This home is located at 1821 Riggs Place NW Unit 1, Washington, DC 20009 and is currently estimated at $552,570, approximately $643 per square foot. 1821 Riggs Place NW Unit 1 is a home located in District of Columbia with nearby schools including Ross Elementary School, Cardozo Education Campus, and Meridian PCS.
Ownership History
Date
Name
Owned For
Owner Type
Purchase Details
Closed on
Jan 17, 2017
Sold by
Bird Jennifer
Bought by
Cherkis Christopher J
Current Estimated Value
Home Financials for this Owner
Home Financials are based on the most recent Mortgage that was taken out on this home.
Original Mortgage
$391,000
Outstanding Balance
$322,312
Interest Rate
4.13%
Mortgage Type
New Conventional
Estimated Equity
$230,258
Purchase Details
Closed on
Feb 22, 2013
Sold by
Gallina James M and Liu Eashen M
Bought by
Thaxton Jennifer
Home Financials for this Owner
Home Financials are based on the most recent Mortgage that was taken out on this home.
Original Mortgage
$355,500
Interest Rate
3.43%
Mortgage Type
New Conventional
Purchase Details
Closed on
Jul 16, 2003
Sold by
Farrell Megan C
Bought by
Gallina James M
Home Financials for this Owner
Home Financials are based on the most recent Mortgage that was taken out on this home.
Original Mortgage
$258,400
Interest Rate
5.34%
Mortgage Type
New Conventional
Create a Home Valuation Report for This Property
The Home Valuation Report is an in-depth analysis detailing your home's value as well as a comparison with similar homes in the area
Home Values in the Area
Average Home Value in this Area
Purchase History
| Date | Buyer | Sale Price | Title Company |
|---|---|---|---|
| Cherkis Christopher J | $460,000 | Kvs Title Llc | |
| Thaxton Jennifer | $395,000 | -- | |
| Gallina James M | $272,000 | -- |
Source: Public Records
Mortgage History
| Date | Status | Borrower | Loan Amount |
|---|---|---|---|
| Open | Cherkis Christopher J | $391,000 | |
| Previous Owner | Thaxton Jennifer | $355,500 | |
| Previous Owner | Gallina James M | $258,400 |
Source: Public Records
Tax History Compared to Growth
Tax History
| Year | Tax Paid | Tax Assessment Tax Assessment Total Assessment is a certain percentage of the fair market value that is determined by local assessors to be the total taxable value of land and additions on the property. | Land | Improvement |
|---|---|---|---|---|
| 2024 | $3,220 | $480,990 | $144,300 | $336,690 |
| 2023 | $3,351 | $492,940 | $147,880 | $345,060 |
| 2022 | $3,398 | $492,250 | $147,670 | $344,580 |
| 2021 | $3,311 | $479,170 | $143,750 | $335,420 |
| 2020 | $3,347 | $469,460 | $140,840 | $328,620 |
| 2019 | $3,258 | $458,160 | $137,450 | $320,710 |
| 2018 | $3,233 | $453,750 | $0 | $0 |
| 2017 | $3,218 | $451,080 | $0 | $0 |
| 2016 | $3,142 | $441,400 | $0 | $0 |
| 2015 | $3,035 | $432,030 | $0 | $0 |
| 2014 | $2,770 | $396,030 | $0 | $0 |
Source: Public Records
Map
Nearby Homes
- 1833 S St NW Unit 20
- 1811 19th St NW Unit 2
- 1830 18th St NW Unit A
- 1828 T St NW
- 1910 S St NW
- 1812 T St NW
- 1755 18th St NW
- 1860 19th St NW
- 1923 S St NW
- 1735 Riggs Place NW
- 1901 19th St NW Unit 203
- 1821 T St NW
- 1920 S St NW Unit 303
- 1811 T St NW
- 1832 Florida Ave NW
- 1749 Swann St NW
- 1741 S St NW
- 1800 R St NW Unit 206
- 1933 18th St NW Unit 304
- 1840 Vernon St NW Unit 402
- 1821 Riggs Place NW Unit 1821
- 1823 Riggs Place NW
- 1823 Riggs Place NW Unit 2
- 1823 Riggs Place NW Unit 5
- 1823 Riggs Place NW Unit 8
- 1823 Riggs Place NW Unit 7
- 1823 Riggs Place NW Unit 6
- 1823 Riggs Place NW Unit 4
- 1823 Riggs Place NW Unit 3
- 1823 Riggs Place NW Unit 1
- 1825 Riggs Place NW Unit 1825
- 1825 Riggs Place NW Unit A
- 1817 Riggs Place NW Unit 3
- 1817 Riggs Place NW
- 1817 Riggs Place NW Unit 2
- 1817 Riggs Place NW Unit 1
- 1819 Riggs Place NW
- 1827 Riggs Place NW
- 1829 Riggs Place NW
- 1815 Riggs Place NW