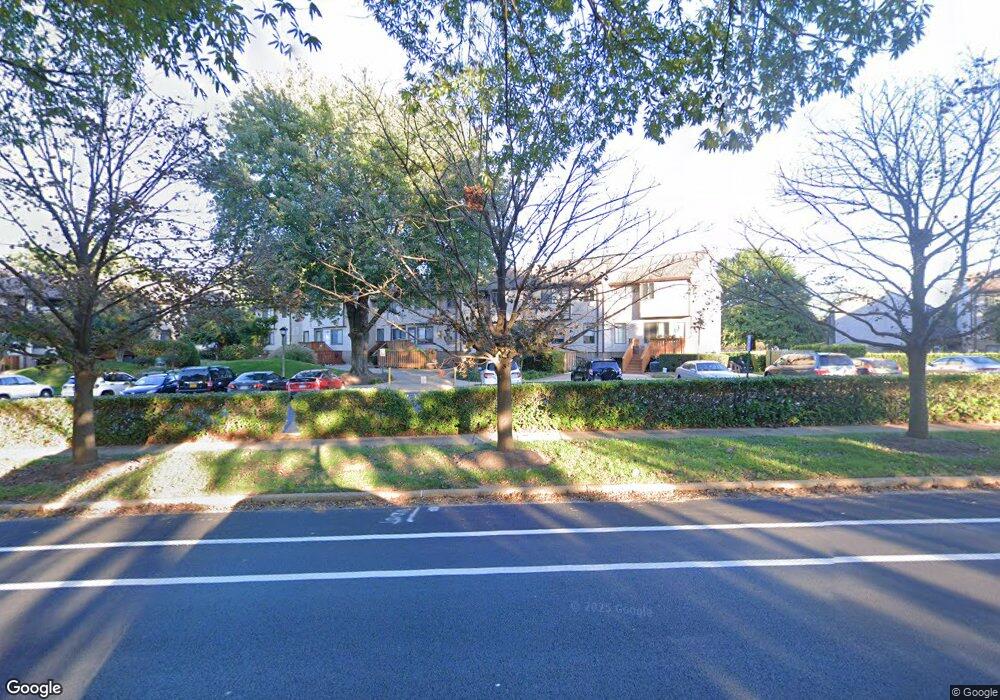
1821 Westwind Way Unit 62 McLean, VA 22102
Tysons Corner NeighborhoodEstimated Value: $398,612 - $470,000
2
Beds
2
Baths
1,060
Sq Ft
$404/Sq Ft
Est. Value
About This Home
This home is located at 1821 Westwind Way Unit 62, McLean, VA 22102 and is currently estimated at $428,403, approximately $404 per square foot. 1821 Westwind Way Unit 62 is a home located in Fairfax County with nearby schools including Westgate Elementary School, Longfellow Middle School, and McLean High School.
Ownership History
Date
Name
Owned For
Owner Type
Purchase Details
Closed on
Aug 25, 2000
Sold by
Liu Ernest
Bought by
Dekhang Chang Chap
Current Estimated Value
Home Financials for this Owner
Home Financials are based on the most recent Mortgage that was taken out on this home.
Original Mortgage
$117,370
Outstanding Balance
$42,656
Interest Rate
8.06%
Mortgage Type
Purchase Money Mortgage
Estimated Equity
$385,747
Purchase Details
Closed on
Aug 5, 1998
Sold by
Stas Eric A
Bought by
Burrows Alan C
Home Financials for this Owner
Home Financials are based on the most recent Mortgage that was taken out on this home.
Original Mortgage
$101,000
Interest Rate
6.92%
Mortgage Type
Purchase Money Mortgage
Purchase Details
Closed on
Jun 10, 1994
Sold by
Sanford Sandra M
Bought by
Stas Michelle P
Home Financials for this Owner
Home Financials are based on the most recent Mortgage that was taken out on this home.
Original Mortgage
$76,500
Interest Rate
8.29%
Mortgage Type
Purchase Money Mortgage
Create a Home Valuation Report for This Property
The Home Valuation Report is an in-depth analysis detailing your home's value as well as a comparison with similar homes in the area
Home Values in the Area
Average Home Value in this Area
Purchase History
| Date | Buyer | Sale Price | Title Company |
|---|---|---|---|
| Dekhang Chang Chap | $121,000 | -- | |
| Burrows Alan C | $103,000 | -- | |
| Stas Michelle P | $102,000 | -- |
Source: Public Records
Mortgage History
| Date | Status | Borrower | Loan Amount |
|---|---|---|---|
| Open | Dekhang Chang Chap | $117,370 | |
| Previous Owner | Stas Michelle P | $101,000 | |
| Previous Owner | Stas Michelle P | $76,500 |
Source: Public Records
Tax History Compared to Growth
Tax History
| Year | Tax Paid | Tax Assessment Tax Assessment Total Assessment is a certain percentage of the fair market value that is determined by local assessors to be the total taxable value of land and additions on the property. | Land | Improvement |
|---|---|---|---|---|
| 2025 | $4,154 | $381,580 | $76,000 | $305,580 |
| 2024 | $4,154 | $343,770 | $69,000 | $274,770 |
| 2023 | $3,972 | $337,030 | $67,000 | $270,030 |
| 2022 | $3,868 | $324,070 | $65,000 | $259,070 |
| 2021 | $4,088 | $334,090 | $67,000 | $267,090 |
| 2020 | $3,781 | $306,500 | $61,000 | $245,500 |
| 2019 | $3,671 | $297,570 | $60,000 | $237,570 |
| 2018 | $3,422 | $297,570 | $60,000 | $237,570 |
| 2017 | $3,962 | $327,160 | $65,000 | $262,160 |
| 2016 | $3,796 | $314,120 | $63,000 | $251,120 |
| 2015 | $3,663 | $314,120 | $63,000 | $251,120 |
| 2014 | $3,557 | $314,120 | $63,000 | $251,120 |
Source: Public Records
Map
Nearby Homes
- 1650 La Salle Ave
- 7486 Carriage Hills Dr
- 1652 Colonial Hills Dr
- 7509 Sawyer Farm Way Unit 2002
- 1781 Chain Bridge Rd Unit 303
- 1781 Chain Bridge Rd Unit 307
- 1747 Gilson St
- 7465 Backett Wood Terrace Unit 1215
- 7552 Sawyer Farm Way Unit 1405
- 7585 Sawyer Farm Way Unit 904
- 7205 Bayside Ct
- 7416 Hallcrest Dr
- 1827 Olmstead Dr
- 7431 Hallcrest Dr
- 7349 Eldorado Ct
- 7505 Magarity Rd
- 7640 Tremayne Place Unit 202
- 1496 Evans Farm Dr
- 1492 Evans Farm Dr
- 7306 Sportsman Dr
- 1805 Westwind Way
- 1817 Westwind Way Unit 61
- 1819 Westwind Way
- 1817 Westwind Way
- 1819 Westwind Way Unit 1819
- 1805 Westwind Way Unit 55
- 1819 Westwind Way Unit 63
- 1809 Westwind Way Unit 56
- 1815 Westwind Way Unit 59
- 1821 Westwind Way
- 1815 Westwind Way
- 1809 Westwind Way
- 1807 Westwind Way
- 1813 Westwind Way
- 1811 Westwind Way
- 1833 Westwind Way
- 1803 Westwind Way
- 1799 Westwind Way
- 1823 Westwind Way Unit 1823
- 1829 Westwind Way Unit 67