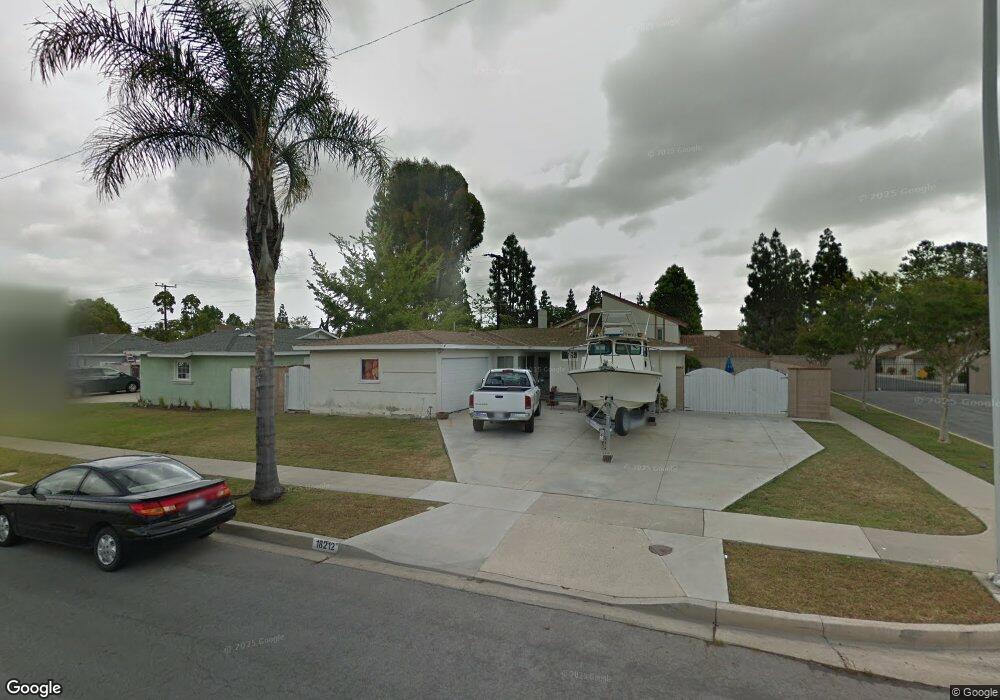
18212 Hartlund Ln Huntington Beach, CA 92646
Estimated Value: $1,111,000 - $1,225,000
3
Beds
3
Baths
1,434
Sq Ft
$827/Sq Ft
Est. Value
About This Home
This home is located at 18212 Hartlund Ln, Huntington Beach, CA 92646 and is currently estimated at $1,185,741, approximately $826 per square foot. 18212 Hartlund Ln is a home located in Orange County with nearby schools including Lake View Elementary, Vista View Middle School, and Ocean View High.
Ownership History
Date
Name
Owned For
Owner Type
Purchase Details
Closed on
Feb 27, 2025
Sold by
Cronk Family Revocable Living Trust and Qtip C Trust
Bought by
Cronk Robert M
Current Estimated Value
Purchase Details
Closed on
Apr 4, 2017
Sold by
Cronk Richard F
Bought by
Cronk Richard F and The Cronk Family Revocable Living Trust
Purchase Details
Closed on
Jul 23, 2013
Sold by
Cronk Robert Frank
Bought by
Cronk Robert Frank and Cronk Family Revocable Living Trust
Home Financials for this Owner
Home Financials are based on the most recent Mortgage that was taken out on this home.
Original Mortgage
$187,000
Interest Rate
3.98%
Mortgage Type
New Conventional
Purchase Details
Closed on
May 28, 2002
Sold by
Cronk Robert F and Cronk Brunilda L
Bought by
Cronk Robert Frank and Cronk Brunilda L
Create a Home Valuation Report for This Property
The Home Valuation Report is an in-depth analysis detailing your home's value as well as a comparison with similar homes in the area
Home Values in the Area
Average Home Value in this Area
Purchase History
| Date | Buyer | Sale Price | Title Company |
|---|---|---|---|
| Cronk Robert M | -- | None Listed On Document | |
| Cronk Richard F | -- | None Available | |
| Cronk Robert Frank | -- | Western Resources Title Comm | |
| Cronk Robert Frank | -- | Western Resources Title Comm | |
| Cronk Robert Frank | -- | -- |
Source: Public Records
Mortgage History
| Date | Status | Borrower | Loan Amount |
|---|---|---|---|
| Previous Owner | Cronk Robert Frank | $187,000 |
Source: Public Records
Tax History Compared to Growth
Tax History
| Year | Tax Paid | Tax Assessment Tax Assessment Total Assessment is a certain percentage of the fair market value that is determined by local assessors to be the total taxable value of land and additions on the property. | Land | Improvement |
|---|---|---|---|---|
| 2025 | $2,271 | $175,048 | $77,572 | $97,476 |
| 2024 | $2,271 | $171,616 | $76,051 | $95,565 |
| 2023 | $2,217 | $168,251 | $74,559 | $93,692 |
| 2022 | $2,180 | $164,952 | $73,097 | $91,855 |
| 2021 | $2,142 | $161,718 | $71,664 | $90,054 |
| 2020 | $2,118 | $160,060 | $70,929 | $89,131 |
| 2019 | $2,086 | $156,922 | $69,538 | $87,384 |
| 2018 | $2,042 | $153,846 | $68,175 | $85,671 |
| 2017 | $2,010 | $150,830 | $66,838 | $83,992 |
| 2016 | $1,935 | $147,873 | $65,527 | $82,346 |
| 2015 | $1,681 | $124,706 | $64,543 | $60,163 |
| 2014 | $1,648 | $122,264 | $63,279 | $58,985 |
Source: Public Records
Map
Nearby Homes
- 8405 Sweetwater Cir
- 18102 Hartlund Ln
- 18101 Wharton Ln
- 18021 Gulf Ln
- 17952 Seaglass Dr
- 18507 Pueblo Cir
- 18555 Vallarta Dr
- 18441 Patterson Ln
- 18601 Newland St Unit 59
- 18601 Newland St Unit 97
- 18601 Newland St Unit 12
- 18601 Newland St Unit 71
- 18601 Newland St Unit 38
- 18702 Demion Ln
- 18566 Santa Andrea St
- 18712 Demion Ln
- 7827 Orchid Dr
- 7841 Essex Dr Unit 201
- 18785 Heavenwood Cir Unit C171
- 17722 Sergio Cir Unit 104
- 18192 Hartlund Ln
- 8381 Sweetwater Cir
- 8385 Sweetwater Cir
- 18232 Hartlund Ln
- 18182 Hartlund Ln
- 8321 Kiner Dr
- 8395 Sweetwater Cir
- 8401 Sweetwater Cir
- 8322 Rolf Cir
- 8392 Sweetwater Cir
- 8322 Kiner Dr
- 18162 Hartlund Ln
- 8311 Kiner Dr
- 8392 Goldsport Cir
- 8396 Sweetwater Cir
- 18242 Hartlund Ln
- 8402 Goldsport Cir
- 8386 Goldsport Cir
- 8406 Goldsport Cir
- 8402 Sweetwater Cir