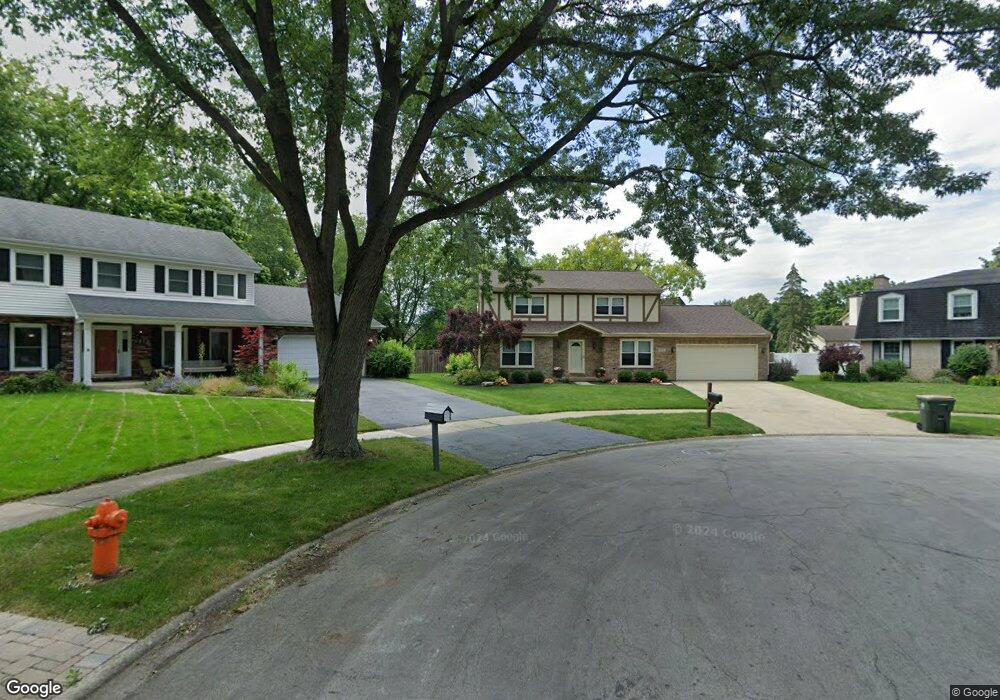
1822 Cliffside Ct Naperville, IL 60565
Signal Point NeighborhoodEstimated Value: $564,457 - $601,000
Studio
1
Bath
2,140
Sq Ft
$274/Sq Ft
Est. Value
About This Home
This home is located at 1822 Cliffside Ct, Naperville, IL 60565 and is currently estimated at $586,364, approximately $274 per square foot. 1822 Cliffside Ct is a home located in DuPage County with nearby schools including Scott Elementary School, Madison Jr High School, and Naperville Central High School.
Ownership History
Date
Name
Owned For
Owner Type
Purchase Details
Closed on
Jan 24, 2020
Sold by
Brockway Sherry L and Brockway John E
Bought by
Brockway John B and Brockway Sherry L
Current Estimated Value
Home Financials for this Owner
Home Financials are based on the most recent Mortgage that was taken out on this home.
Original Mortgage
$255,300
Outstanding Balance
$227,277
Interest Rate
4%
Mortgage Type
New Conventional
Estimated Equity
$359,087
Purchase Details
Closed on
Aug 1, 2017
Sold by
Larson Philip C and Brockway Sherry L
Bought by
Larson Philip C and Brockway Sherry L
Purchase Details
Closed on
Jul 27, 2001
Sold by
Bengtson Alvin H and Bengtson Virginia L
Bought by
Larson Philip C and Brockway Sherry L
Home Financials for this Owner
Home Financials are based on the most recent Mortgage that was taken out on this home.
Original Mortgage
$200,000
Interest Rate
7.14%
Create a Home Valuation Report for This Property
The Home Valuation Report is an in-depth analysis detailing your home's value as well as a comparison with similar homes in the area
Home Values in the Area
Average Home Value in this Area
Purchase History
| Date | Buyer | Sale Price | Title Company |
|---|---|---|---|
| Brockway John B | -- | Precision Title | |
| Larson Philip C | -- | Attorney | |
| Larson Philip C | $270,500 | Collar Counties Title Plant |
Source: Public Records
Mortgage History
| Date | Status | Borrower | Loan Amount |
|---|---|---|---|
| Open | Brockway John B | $255,300 | |
| Closed | Larson Philip C | $200,000 |
Source: Public Records
Tax History
| Year | Tax Paid | Tax Assessment Tax Assessment Total Assessment is a certain percentage of the fair market value that is determined by local assessors to be the total taxable value of land and additions on the property. | Land | Improvement |
|---|---|---|---|---|
| 2024 | $8,727 | $160,454 | $69,566 | $90,888 |
| 2023 | $8,346 | $146,440 | $63,490 | $82,950 |
| 2022 | $8,151 | $138,950 | $60,240 | $78,710 |
| 2021 | $7,834 | $133,690 | $57,960 | $75,730 |
| 2020 | $7,679 | $131,290 | $56,920 | $74,370 |
| 2019 | $7,741 | $125,610 | $54,460 | $71,150 |
| 2018 | $7,743 | $125,610 | $54,460 | $71,150 |
| 2017 | $7,715 | $121,370 | $52,620 | $68,750 |
| 2016 | $7,559 | $116,980 | $50,720 | $66,260 |
| 2015 | $7,508 | $110,160 | $47,760 | $62,400 |
| 2014 | $7,553 | $107,480 | $45,700 | $61,780 |
| 2013 | $7,440 | $107,740 | $45,810 | $61,930 |
Source: Public Records
Map
Nearby Homes
- 517 Sheffield Rd
- 621 Bourbon Ct
- 1715 Amelia Ct
- 425 Carriage Hill Rd
- 1612 Indian Trail Dr
- 1123 Mill Race Ln
- 1217 River Oak Dr
- 1712 Coach Dr
- 264 E Bailey Rd Unit C
- 2103 Primrose Ln
- 228 E Bailey Rd Unit F
- 1406 River Oak Dr
- 805 Potomac Ave
- 144 E Bailey Rd Unit D
- 307 Leeds Ct
- 138 E Bailey Rd Unit M
- 321 Carriage Hill Rd
- 124 E Bailey Rd Unit E
- 1546 Treeline Ct Unit 405
- 510 Harlowe Ln Unit 2001C
- 1818 Cliffside Ct
- 1821 Cliffside Ct
- 1828 Mountain Ct
- 1829 Mountain Ct
- 1817 Cliffside Ct
- 1814 Cliffside Ct
- 1832 Mountain Ct
- 1823 Deerpath Ct
- 1811 Cliffside Ct
- 1833 Leabrook Ct
- 1810 Cliffside Ct
- 1833 Mountain Ct
- 1827 Deerpath Ct
- 1829 Leabrook Ct
- 1817 Deerpath Ct
- 1836 Mountain Ct
- 1816 Winola Ct
- 1807 Cliffside Ct
- 1806 Cliffside Ct
- 1813 Deerpath Ct
Your Personal Tour Guide
Ask me questions while you tour the home.