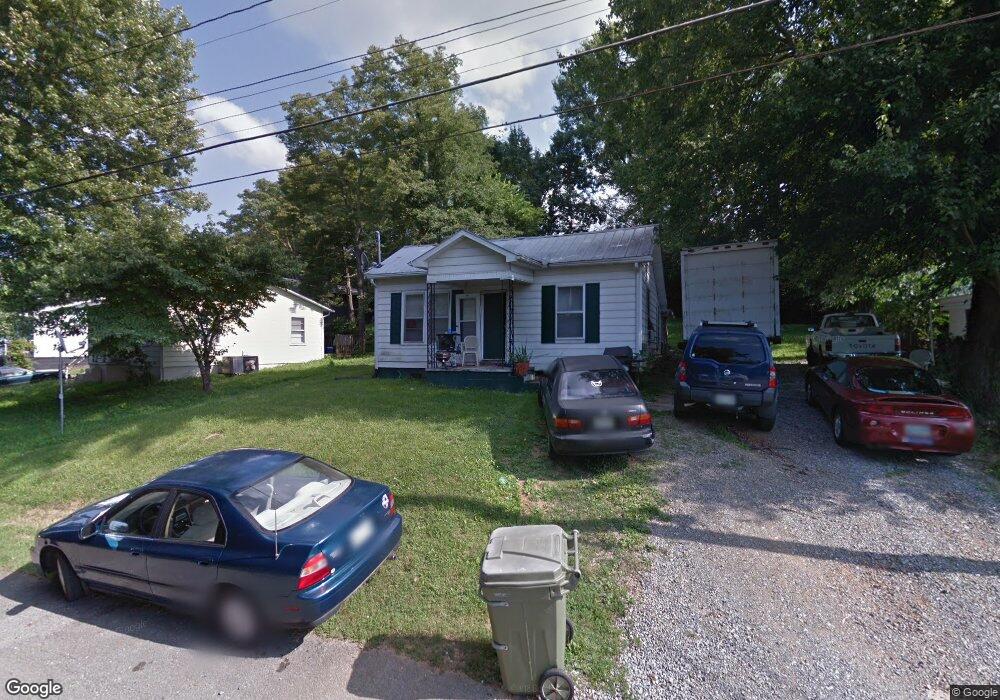
1822 Emerson St Morristown, TN 37814
Estimated Value: $58,000 - $152,000
--
Bed
1
Bath
896
Sq Ft
$110/Sq Ft
Est. Value
About This Home
This home is located at 1822 Emerson St, Morristown, TN 37814 and is currently estimated at $98,570, approximately $110 per square foot. 1822 Emerson St is a home located in Hamblen County with nearby schools including Fairview-Marguerite Elementary School, Meadowview Middle School, and Morristown East High School.
Ownership History
Date
Name
Owned For
Owner Type
Purchase Details
Closed on
Jan 16, 2023
Sold by
Romero-Martinez Elmer E
Bought by
Romero Bryan
Current Estimated Value
Home Financials for this Owner
Home Financials are based on the most recent Mortgage that was taken out on this home.
Original Mortgage
$50,000
Interest Rate
6.49%
Mortgage Type
Seller Take Back
Purchase Details
Closed on
Apr 13, 2021
Sold by
Sams Rhonda
Bought by
Romero Martinez Elmer E
Purchase Details
Closed on
Oct 31, 2007
Bought by
Sams Bobby and Sams Rhonda
Purchase Details
Closed on
Oct 19, 2006
Bought by
Lampkin Chris L
Purchase Details
Closed on
Mar 13, 2001
Sold by
Wadlington William B H
Bought by
Lampkin Chris L
Purchase Details
Closed on
Oct 3, 2000
Sold by
Synamon Ethel M
Bought by
Wadlington Bill
Purchase Details
Closed on
Jun 5, 1985
Bought by
Synamon Ethel M
Purchase Details
Closed on
Nov 27, 1968
Create a Home Valuation Report for This Property
The Home Valuation Report is an in-depth analysis detailing your home's value as well as a comparison with similar homes in the area
Home Values in the Area
Average Home Value in this Area
Purchase History
| Date | Buyer | Sale Price | Title Company |
|---|---|---|---|
| Romero Bryan | $60,000 | Blue Ridge Title | |
| Romero Martinez Elmer E | $35,000 | Blue Ridge Title Company Llc | |
| Romero-Martinez Elmer E | $35,000 | None Listed On Document | |
| Sams Bobby | $101,300 | -- | |
| Lampkin Chris L | -- | -- | |
| Lampkin Chris L | $38,800 | -- | |
| Wadlington Bill | $32,500 | -- | |
| Synamon Ethel M | -- | -- | |
| -- | -- | -- |
Source: Public Records
Mortgage History
| Date | Status | Borrower | Loan Amount |
|---|---|---|---|
| Closed | Romero Bryan | $50,000 |
Source: Public Records
Tax History Compared to Growth
Tax History
| Year | Tax Paid | Tax Assessment Tax Assessment Total Assessment is a certain percentage of the fair market value that is determined by local assessors to be the total taxable value of land and additions on the property. | Land | Improvement |
|---|---|---|---|---|
| 2024 | $238 | $13,550 | $2,275 | $11,275 |
| 2023 | $238 | $13,550 | $0 | $0 |
| 2022 | $428 | $13,550 | $2,275 | $11,275 |
| 2021 | $376 | $11,900 | $2,275 | $9,625 |
| 2020 | $375 | $11,900 | $2,275 | $9,625 |
| 2019 | $360 | $10,600 | $2,225 | $8,375 |
| 2018 | $334 | $10,600 | $2,225 | $8,375 |
| 2017 | $328 | $10,600 | $2,225 | $8,375 |
| 2016 | $314 | $10,600 | $2,225 | $8,375 |
| 2015 | $292 | $10,600 | $2,225 | $8,375 |
| 2014 | -- | $10,600 | $2,225 | $8,375 |
| 2013 | -- | $12,725 | $0 | $0 |
Source: Public Records
Map
Nearby Homes
- 2035 Reese St
- 1250 N Liberty Hill Dr
- 2165 Brights Pike
- 1864 Limestone Path
- 1449 N Easley Ct
- 1683 Pebblestone Ct
- 2320 Southern Dr
- 910 Lloyd St
- 2052 Fairview Rd
- 1961 Brights View Ln
- 1250 N Liberty Hill Rd
- 000 Devault St
- 1635 Meadowview Ln
- 1643 Meadowview Ln
- 1420 Buffalo Trail
- 1504 Tyler Cir
- 1486 Short St
- 1111 Carmichael St
- 1562 Shields Ferry Rd
- 1542 Shields Ferry Rd
- 1828 Emerson St
- 1832 Emerson St
- 1810 Emerson St
- 1820 Sherwood Dr
- 1833 Emerson St
- 1834 Emerson St
- 1806 Emerson St
- 1910 Sherwood Dr
- 1910 Sherwood Dr
- 1852 Emerson St
- 1802 Sherwood Dr
- 1915 N Liberty Hill Rd
- 1905 N Liberty Hill Rd
- 1860 Emerson St
- 1829 N Liberty Hill Rd
- 1905 N Liberty Hill Dr
- 0 Medlin Rd
- 1649 Medlin Rd
- 1825 Sherwood Dr
- 1821 N Liberty Hill Rd