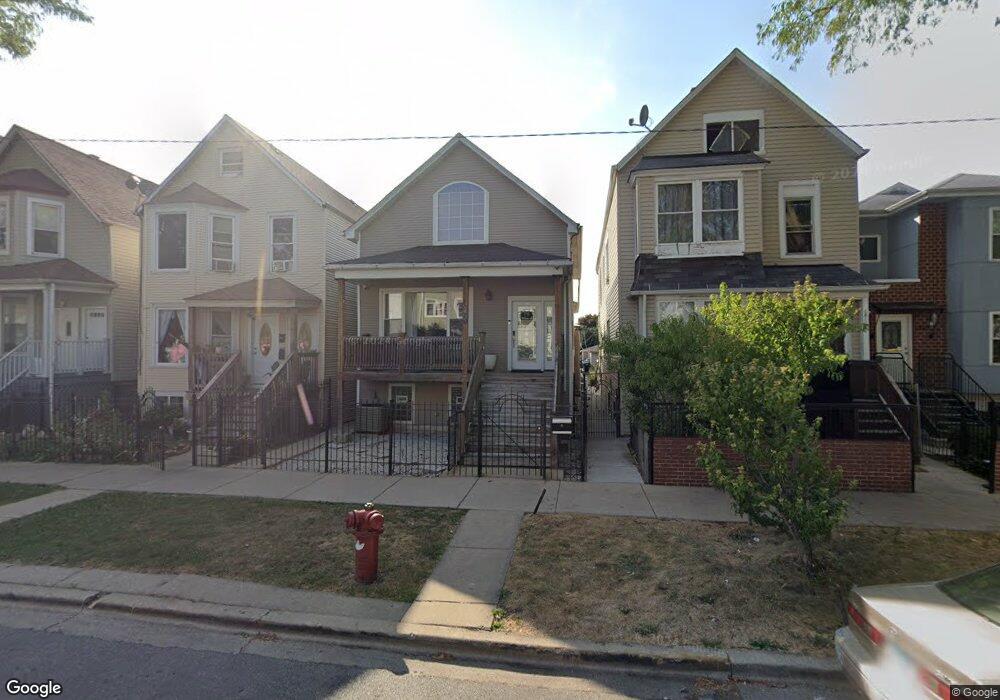
1822 N Drake Ave Chicago, IL 60647
Logan Square NeighborhoodEstimated Value: $447,394 - $653,000
2
Beds
1
Bath
929
Sq Ft
$591/Sq Ft
Est. Value
About This Home
This home is located at 1822 N Drake Ave, Chicago, IL 60647 and is currently estimated at $549,099, approximately $591 per square foot. 1822 N Drake Ave is a home located in Cook County with nearby schools including McAuliffe Elementary School and North-Grand High School.
Ownership History
Date
Name
Owned For
Owner Type
Purchase Details
Closed on
Sep 17, 2004
Sold by
Neels Jesus and Neels Teresa
Bought by
Badillo Enrique
Current Estimated Value
Home Financials for this Owner
Home Financials are based on the most recent Mortgage that was taken out on this home.
Original Mortgage
$188,000
Interest Rate
7.65%
Mortgage Type
Unknown
Purchase Details
Closed on
Mar 19, 1999
Sold by
Neels Theresa
Bought by
Mendez Benjamin Alvarez
Purchase Details
Closed on
Aug 15, 1997
Sold by
Neels Jesus and Neels Theresa
Bought by
Alvarez Benjamin and Neels Theresa
Purchase Details
Closed on
Jul 19, 1996
Sold by
Neels Theresa and Neels Teresa
Bought by
Neels Jesus and Neels Theresa
Home Financials for this Owner
Home Financials are based on the most recent Mortgage that was taken out on this home.
Original Mortgage
$35,300
Interest Rate
8.33%
Create a Home Valuation Report for This Property
The Home Valuation Report is an in-depth analysis detailing your home's value as well as a comparison with similar homes in the area
Home Values in the Area
Average Home Value in this Area
Purchase History
| Date | Buyer | Sale Price | Title Company |
|---|---|---|---|
| Badillo Enrique | -- | Multiple | |
| Badillo Enrique | $235,000 | Chicago Title Insurance Comp | |
| Mendez Benjamin Alvarez | -- | -- | |
| Alvarez Benjamin | -- | -- | |
| Neels Jesus | -- | -- |
Source: Public Records
Mortgage History
| Date | Status | Borrower | Loan Amount |
|---|---|---|---|
| Previous Owner | Badillo Enrique | $188,000 | |
| Previous Owner | Neels Jesus | $35,300 | |
| Closed | Badillo Enrique | $47,000 |
Source: Public Records
Tax History Compared to Growth
Tax History
| Year | Tax Paid | Tax Assessment Tax Assessment Total Assessment is a certain percentage of the fair market value that is determined by local assessors to be the total taxable value of land and additions on the property. | Land | Improvement |
|---|---|---|---|---|
| 2024 | $7,344 | $29,000 | $15,496 | $13,504 |
| 2023 | $7,137 | $38,000 | $13,275 | $24,725 |
| 2022 | $7,137 | $38,000 | $13,275 | $24,725 |
| 2021 | $6,995 | $38,000 | $13,275 | $24,725 |
| 2020 | $4,202 | $21,897 | $6,416 | $15,481 |
| 2019 | $4,270 | $24,604 | $6,416 | $18,188 |
| 2018 | $4,182 | $24,604 | $6,416 | $18,188 |
| 2017 | $3,364 | $19,000 | $5,752 | $13,248 |
| 2016 | $3,305 | $19,000 | $5,752 | $13,248 |
| 2015 | $3,001 | $19,000 | $5,752 | $13,248 |
| 2014 | $2,799 | $17,656 | $5,310 | $12,346 |
| 2013 | $2,733 | $17,656 | $5,310 | $12,346 |
Source: Public Records
Map
Nearby Homes
- 3544 W Cortland St Unit BA
- 3518 W Cortland St
- 1819 N Saint Louis Ave Unit 1FS
- 1703 N Monticello Ave
- 1725 N Lawndale Ave
- 1921 N Lawndale Ave
- 1940 N Monticello Ave
- 1951 N Monticello Ave Unit 1
- 3522 W Armitage Ave
- 1816 N Spaulding Ave Unit 8
- 1701 N Kimball Ave
- 3462 W North Ave
- 1714 N Spaulding Ave Unit Garage
- 3721 W Wabansia Ave
- 1747 N Spaulding Ave
- 1940 N Ridgeway Ave Unit 2
- 3575 W Dickens Ave
- 1814 N Sawyer Ave
- 3645 W Dickens Ave
- 1622 N Spaulding Ave
- 1826 N Drake Ave
- 1820 N Drake Ave Unit 1
- 1820 N Drake Ave
- 1828 N Drake Ave
- 1818 N Drake Ave
- 1816 N Drake Ave
- 1816 N Drake Ave
- 1832 N Drake Ave
- 1832 N Drake Ave
- 1830 N Drake Ave Unit 1
- 1814 N Drake Ave
- 1834 N Drake Ave
- 1812 N Drake Ave
- 1838 N Drake Ave
- 1823 N Drake Ave Unit 2
- 1840 N Drake Ave
- 1831 N Drake Ave
- 1829 N Drake Ave
- 1829 N Drake Ave Unit 2F
- 1829 N Drake Ave Unit 2R