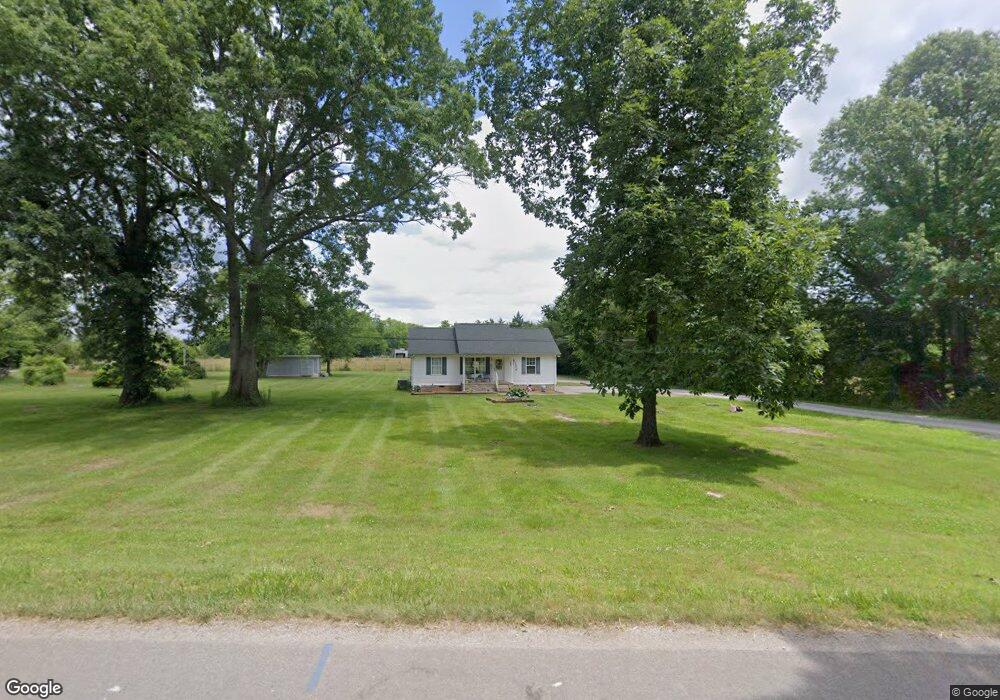
1822 Wade Brown Rd Lewisburg, TN 37091
Estimated Value: $222,057 - $284,000
--
Bed
2
Baths
1,025
Sq Ft
$261/Sq Ft
Est. Value
About This Home
This home is located at 1822 Wade Brown Rd, Lewisburg, TN 37091 and is currently estimated at $267,014, approximately $260 per square foot. 1822 Wade Brown Rd is a home located in Marshall County with nearby schools including Oak Grove Elementary School, Marshall Elementary School, and Westhills Elementary School.
Ownership History
Date
Name
Owned For
Owner Type
Purchase Details
Closed on
May 22, 2007
Sold by
Carter James R and Carter Cynthi
Bought by
Lisa Coelane
Current Estimated Value
Home Financials for this Owner
Home Financials are based on the most recent Mortgage that was taken out on this home.
Original Mortgage
$86,000
Outstanding Balance
$52,283
Interest Rate
6.16%
Estimated Equity
$214,731
Purchase Details
Closed on
Sep 29, 2006
Sold by
Orr Douglas P
Bought by
Carter James R and Carter Cynthia
Home Financials for this Owner
Home Financials are based on the most recent Mortgage that was taken out on this home.
Original Mortgage
$70,000
Interest Rate
6.36%
Purchase Details
Closed on
Feb 2, 2004
Sold by
Darrell Mceachron
Bought by
Douglas Orr and Douglas Kathy
Purchase Details
Closed on
Jan 21, 2004
Sold by
Lester Carlton and Lester Betty
Bought by
Darrell Mceachron
Purchase Details
Closed on
Jan 10, 2004
Bought by
Mceachron Darrell
Create a Home Valuation Report for This Property
The Home Valuation Report is an in-depth analysis detailing your home's value as well as a comparison with similar homes in the area
Home Values in the Area
Average Home Value in this Area
Purchase History
| Date | Buyer | Sale Price | Title Company |
|---|---|---|---|
| Lisa Coelane | $86,000 | -- | |
| Carter James R | $19,500 | -- | |
| Douglas Orr | $11,000 | -- | |
| Darrell Mceachron | $4,800 | -- | |
| Darrell Mceachron | $500 | -- | |
| Mceachron Darrell | -- | -- |
Source: Public Records
Mortgage History
| Date | Status | Borrower | Loan Amount |
|---|---|---|---|
| Open | Mceachron Darrell | $86,000 | |
| Previous Owner | Mceachron Darrell | $70,000 |
Source: Public Records
Tax History Compared to Growth
Tax History
| Year | Tax Paid | Tax Assessment Tax Assessment Total Assessment is a certain percentage of the fair market value that is determined by local assessors to be the total taxable value of land and additions on the property. | Land | Improvement |
|---|---|---|---|---|
| 2024 | $746 | $41,000 | $7,100 | $33,900 |
| 2023 | $746 | $41,000 | $7,100 | $33,900 |
| 2022 | $746 | $41,000 | $7,100 | $33,900 |
| 2021 | $661 | $23,500 | $2,425 | $21,075 |
| 2020 | $661 | $23,500 | $2,425 | $21,075 |
| 2019 | $661 | $23,500 | $2,425 | $21,075 |
| 2018 | $609 | $23,500 | $2,425 | $21,075 |
| 2017 | $609 | $22,050 | $2,425 | $19,625 |
| 2016 | $600 | $18,625 | $2,500 | $16,125 |
| 2015 | $600 | $18,625 | $2,500 | $16,125 |
| 2014 | $600 | $18,625 | $2,500 | $16,125 |
Source: Public Records
Map
Nearby Homes
- 1820 Wade Brown Rd
- 1816 Wade Brown Rd
- 3130 Nashville Hwy
- 3077 Nashville Hwy
- 1510 Wade Brown Rd
- 2220 Hunter Bills Rd
- 2001 Highway 40
- 2109 Mae Ln
- 2137 Horton Way
- 0 Wallace Thompson Rd
- 1798 Twin Caves Dr
- 3293 Nashville Hwy
- 0 Anes Station Rd
- 2150 Highway 40
- 3388 Anes Station Rd
- 3327 Nashville Hwy
- 2421 Anes Station Rd
- 2159 Verona Caney Rd
- 1830 Bethbirei Rd
- 2989 Stegall Rd
- 1848 Wade Brown Rd
- 1813 Wade Brown Rd
- 1850 Wade Brown Rd
- 1815 Wade Brown Rd
- 1788 Wade Brown Rd
- 1854 Wade Brown Rd
- 1856 Wade Brown Rd
- 1778 Wade Brown Rd
- 1766 Wade Brown Rd
- 1880 Wade Brown Rd
- 1814 Wade Brown Rd
- 1761 Wade Brown Rd
- 1885 Wade Brown Rd
- 1870 Wade Brown Rd
- 1746 Wade Brown Rd
- 1907 Wade Brown Rd
- 1739 Wade Brown Rd
- 1781 Wade Brown
- 1726 Wade Brown Rd
- 1717 Wade Brown Rd