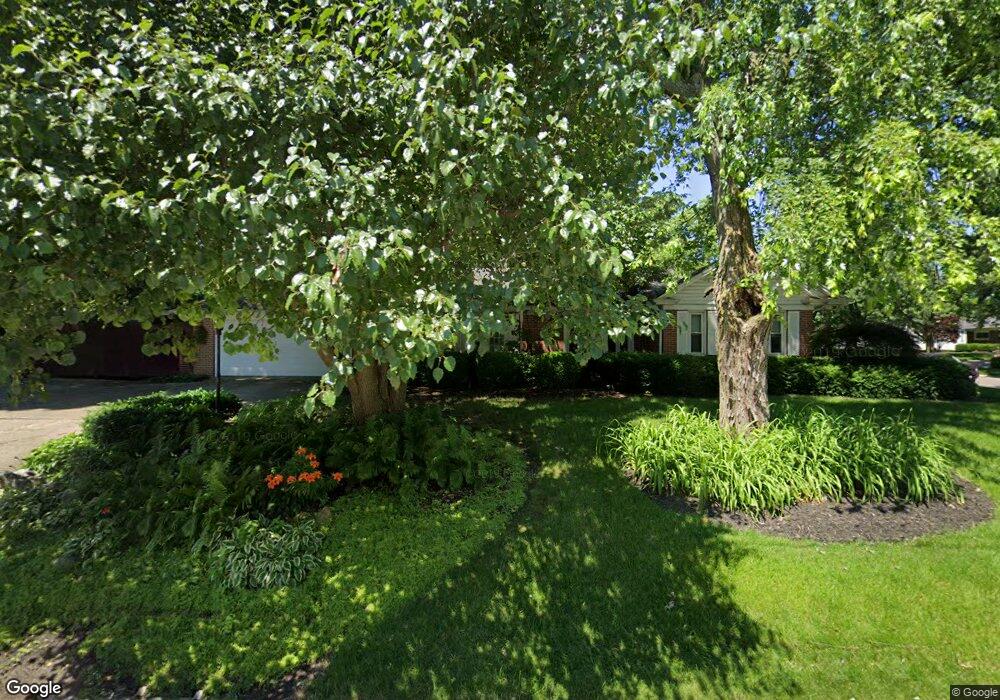
1823 Broadway Ave Sidney, OH 45365
Estimated Value: $253,000 - $284,000
2
Beds
3
Baths
1,747
Sq Ft
$151/Sq Ft
Est. Value
About This Home
This home is located at 1823 Broadway Ave, Sidney, OH 45365 and is currently estimated at $264,494, approximately $151 per square foot. 1823 Broadway Ave is a home located in Shelby County with nearby schools including Sidney High School, Holy Angels Catholic School, and Christian Academy Schools.
Ownership History
Date
Name
Owned For
Owner Type
Purchase Details
Closed on
Oct 25, 2019
Sold by
Thorne Beth A and Harp Jeffrey K
Bought by
Harp Beth A and Harp Jeffrey K
Current Estimated Value
Purchase Details
Closed on
Dec 13, 2013
Sold by
Thorne Robert P
Bought by
Thorne Beth
Home Financials for this Owner
Home Financials are based on the most recent Mortgage that was taken out on this home.
Original Mortgage
$110,400
Interest Rate
4.45%
Mortgage Type
New Conventional
Purchase Details
Closed on
Apr 24, 1998
Sold by
Means Joan D
Bought by
Thorne Robert P
Home Financials for this Owner
Home Financials are based on the most recent Mortgage that was taken out on this home.
Original Mortgage
$102,000
Interest Rate
7.26%
Mortgage Type
VA
Purchase Details
Closed on
Sep 27, 1995
Sold by
Est Frances H Courter
Bought by
Means Joan D and Means Michael H
Create a Home Valuation Report for This Property
The Home Valuation Report is an in-depth analysis detailing your home's value as well as a comparison with similar homes in the area
Home Values in the Area
Average Home Value in this Area
Purchase History
| Date | Buyer | Sale Price | Title Company |
|---|---|---|---|
| Harp Beth A | -- | None Available | |
| Thorne Beth | $30,000 | None Available | |
| Thorne Robert P | $100,000 | -- | |
| Means Joan D | $95,000 | -- |
Source: Public Records
Mortgage History
| Date | Status | Borrower | Loan Amount |
|---|---|---|---|
| Previous Owner | Thorne Beth | $110,400 | |
| Previous Owner | Thorne Robert P | $102,000 |
Source: Public Records
Tax History Compared to Growth
Tax History
| Year | Tax Paid | Tax Assessment Tax Assessment Total Assessment is a certain percentage of the fair market value that is determined by local assessors to be the total taxable value of land and additions on the property. | Land | Improvement |
|---|---|---|---|---|
| 2024 | $2,486 | $70,830 | $15,400 | $55,430 |
| 2023 | $2,486 | $70,830 | $15,400 | $55,430 |
| 2022 | $2,168 | $54,130 | $12,250 | $41,880 |
| 2021 | $2,190 | $54,130 | $12,250 | $41,880 |
| 2020 | $2,190 | $54,130 | $12,250 | $41,880 |
| 2019 | $1,831 | $44,730 | $10,150 | $34,580 |
| 2018 | $1,780 | $44,730 | $10,150 | $34,580 |
| 2017 | $1,758 | $44,730 | $10,150 | $34,580 |
| 2016 | $1,666 | $42,300 | $10,150 | $32,150 |
| 2015 | $1,652 | $42,300 | $10,150 | $32,150 |
| 2014 | $1,652 | $41,840 | $10,150 | $31,690 |
| 2013 | $1,738 | $40,680 | $10,150 | $30,530 |
Source: Public Records
Map
Nearby Homes
- 120 E Pinehurst St
- 402 E Russell Rd
- 115 E Pinehurst St
- 111 W Pinehurst St
- 115 W Ruth St
- 2303 Armstrong Dr
- 748 Stratford Dr
- 401 New St
- 128 Village Green Dr
- 1314 N Main Ave
- 134 Leisure Ct
- 0 Sunshine Dr
- 718 Addy Ave
- 410 Summit St
- 0 Windsor Park
- 2360 Wapakoneta Ave Unit 106
- 1251 Driftwood Trail
- 1131 E Parkwood St
- 605 Arrowhead Dr
- 804 N Miami Ave
- 0 Broadway Ave
- 1824 Broadway Ave
- 447 E Edgewood St
- 1828 Broadway Ave
- 1801 Broadway Ave
- 1820 Broadway Ave
- 456 E Edgewood St
- 439 E Edgewood St
- 436 E Pinehurst St
- 448 E Edgewood St
- 438 E Edgewood St
- 1904 Broadway Ave
- 1910 Broadway Ave
- 431 E Edgewood St
- 430 E Pinehurst St
- 1925 Broadway Ave
- 1809 Burkewood Dr
- 430 E Edgewood St
- 447 E Robinwood St
- 424 E Pinehurst St