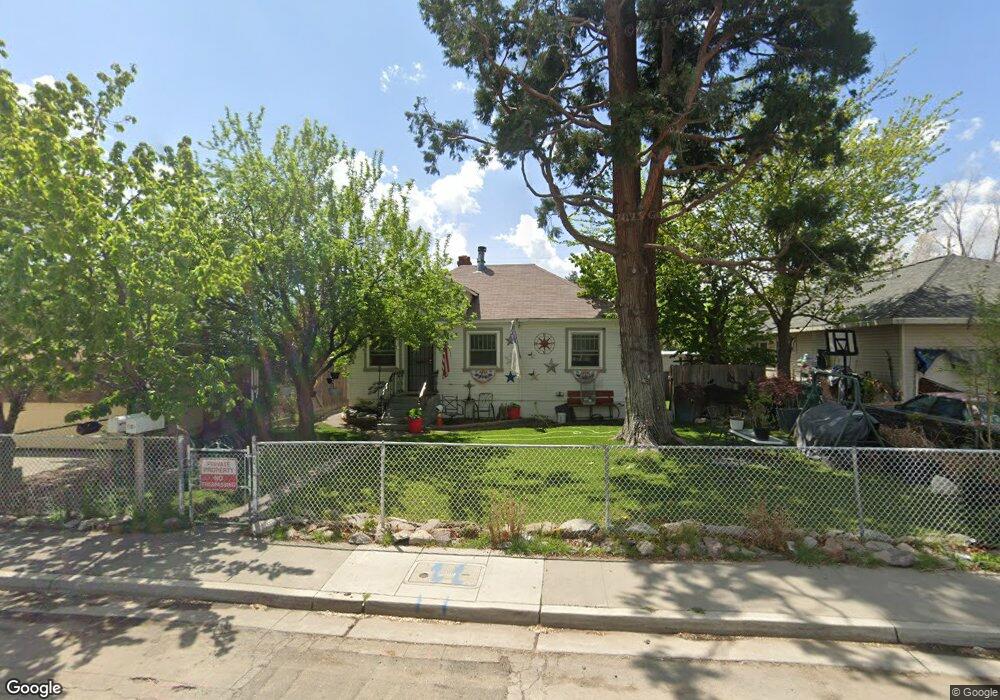
1823 F St Sparks, NV 89431
Downtown Sparks NeighborhoodEstimated Value: $404,801 - $618,000
2
Beds
2
Baths
1,657
Sq Ft
$311/Sq Ft
Est. Value
About This Home
This home is located at 1823 F St, Sparks, NV 89431 and is currently estimated at $515,200, approximately $310 per square foot. 1823 F St is a home located in Washoe County with nearby schools including Kate M Smith Elementary School, Sparks Middle School, and Sparks High School.
Ownership History
Date
Name
Owned For
Owner Type
Purchase Details
Closed on
Jul 6, 2011
Sold by
Beroza Edward John
Bought by
Lopes Investments
Current Estimated Value
Purchase Details
Closed on
Jul 7, 2004
Sold by
Byrne Hugh C
Bought by
Beroza Edward John
Home Financials for this Owner
Home Financials are based on the most recent Mortgage that was taken out on this home.
Original Mortgage
$192,000
Interest Rate
6.37%
Mortgage Type
Unknown
Purchase Details
Closed on
Mar 24, 1994
Sold by
Byrne Hugh C
Bought by
Byrne Hugh C
Home Financials for this Owner
Home Financials are based on the most recent Mortgage that was taken out on this home.
Original Mortgage
$57,000
Interest Rate
3.5%
Create a Home Valuation Report for This Property
The Home Valuation Report is an in-depth analysis detailing your home's value as well as a comparison with similar homes in the area
Home Values in the Area
Average Home Value in this Area
Purchase History
| Date | Buyer | Sale Price | Title Company |
|---|---|---|---|
| Lopes Investments | $82,700 | Fidelity Natl Title Ins Co | |
| Beroza Edward John | $240,000 | Stewart Title Of Northern Nv | |
| Byrne Hugh C | -- | Founders Title Company |
Source: Public Records
Mortgage History
| Date | Status | Borrower | Loan Amount |
|---|---|---|---|
| Previous Owner | Beroza Edward John | $192,000 | |
| Previous Owner | Byrne Hugh C | $57,000 |
Source: Public Records
Tax History Compared to Growth
Tax History
| Year | Tax Paid | Tax Assessment Tax Assessment Total Assessment is a certain percentage of the fair market value that is determined by local assessors to be the total taxable value of land and additions on the property. | Land | Improvement |
|---|---|---|---|---|
| 2025 | $1,436 | $78,307 | $41,720 | $36,587 |
| 2024 | $1,436 | $73,491 | $38,710 | $34,781 |
| 2023 | $1,395 | $71,913 | $39,305 | $32,608 |
| 2022 | $1,357 | $59,730 | $32,865 | $26,865 |
| 2021 | $1,326 | $51,936 | $25,375 | $26,561 |
| 2020 | $1,284 | $52,658 | $26,250 | $26,408 |
| 2019 | $1,249 | $47,723 | $22,470 | $25,253 |
| 2018 | $1,212 | $39,717 | $15,190 | $24,527 |
| 2017 | $1,178 | $38,349 | $14,000 | $24,349 |
| 2016 | $1,147 | $35,850 | $11,200 | $24,650 |
| 2015 | $1,149 | $32,374 | $8,050 | $24,324 |
| 2014 | $1,111 | $30,291 | $7,000 | $23,291 |
| 2013 | -- | $29,413 | $6,160 | $23,253 |
Source: Public Records
Map
Nearby Homes
- 1720 G St
- 848 Rock Blvd
- 1830 C St
- 1756 I St
- 234 18th St
- 2136 Roundhouse Rd
- 2168 Cannonball Rd
- 1841 Merchant St
- 973 Damon Ln
- 1889 Merchant St
- 1560 Steven Ct Unit 2
- 1536 Irene Way
- 2380 Roundhouse Rd
- 2335 Roundhouse Rd
- 1527 Steven Ct
- 2385 Pauline Ave
- 1855 Verano Dr
- 1010 12th St
- 1780 Greenbrae Dr
- 1365 Prospect Ave