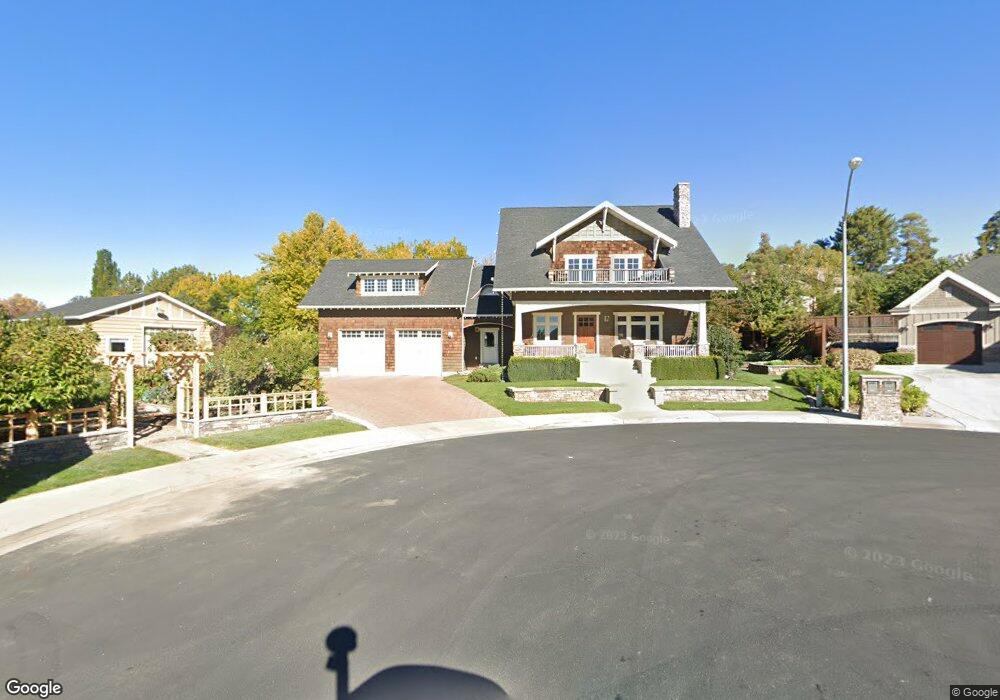
1823 N 1950 W Provo, UT 84604
Grandview North NeighborhoodEstimated Value: $755,000 - $1,054,000
3
Beds
3
Baths
3,752
Sq Ft
$251/Sq Ft
Est. Value
About This Home
This home is located at 1823 N 1950 W, Provo, UT 84604 and is currently estimated at $943,603, approximately $251 per square foot. 1823 N 1950 W is a home with nearby schools including Westridge Elementary School, Dixon Middle School, and Provo High School.
Ownership History
Date
Name
Owned For
Owner Type
Purchase Details
Closed on
Feb 5, 2026
Sold by
Thomas Dan E and Thomas Lisa A
Bought by
Thomas Family Trust and Thomas
Current Estimated Value
Home Financials for this Owner
Home Financials are based on the most recent Mortgage that was taken out on this home.
Original Mortgage
$900,000
Outstanding Balance
$900,000
Interest Rate
6.18%
Mortgage Type
Credit Line Revolving
Estimated Equity
$43,603
Purchase Details
Closed on
Apr 14, 2021
Sold by
Thomas Dan and Thomas Lisa
Bought by
Thomas Dan Eugene and Thomas Lisa Andersen
Home Financials for this Owner
Home Financials are based on the most recent Mortgage that was taken out on this home.
Original Mortgage
$74,000
Interest Rate
3%
Mortgage Type
Credit Line Revolving
Purchase Details
Closed on
Oct 4, 2004
Sold by
Stewart Charles W and Stewart Kelly L
Bought by
Thomas Dan and Thomas Lisa
Purchase Details
Closed on
Oct 11, 2001
Sold by
Ingram T David and Ingram Gail
Bought by
Stewart Charles W and Stewart Kelly
Purchase Details
Closed on
Jun 27, 2001
Sold by
Van Buren Construction Inc
Bought by
Ingram T David and Ingram Gail
Purchase Details
Closed on
Jun 1, 1998
Sold by
Merlynn K Jones Real Estates Company Ltd
Bought by
Vanburen Construction Inc
Create a Home Valuation Report for This Property
The Home Valuation Report is an in-depth analysis detailing your home's value as well as a comparison with similar homes in the area
Home Values in the Area
Average Home Value in this Area
Purchase History
| Date | Buyer | Sale Price | Title Company |
|---|---|---|---|
| Thomas Family Trust | -- | Utah First Title | |
| Thomas Dan E | -- | Utah First Title | |
| Thomas Dan Eugene | -- | None Available | |
| Thomas Dan | -- | Access Title Company | |
| Stewart Charles W | -- | Access Title Company | |
| Ingram T David | -- | Access Title Company | |
| Vanburen Construction Inc | -- | -- |
Source: Public Records
Mortgage History
| Date | Status | Borrower | Loan Amount |
|---|---|---|---|
| Open | Thomas Dan E | $900,000 | |
| Previous Owner | Thomas Dan Eugene | $74,000 |
Source: Public Records
Tax History
| Year | Tax Paid | Tax Assessment Tax Assessment Total Assessment is a certain percentage of the fair market value that is determined by local assessors to be the total taxable value of land and additions on the property. | Land | Improvement |
|---|---|---|---|---|
| 2025 | $5,364 | $528,550 | -- | -- |
| 2024 | $5,565 | $528,000 | $0 | $0 |
| 2023 | $1,469 | $539,990 | $0 | $0 |
| 2022 | $5,128 | $501,765 | $0 | $0 |
| 2021 | $4,286 | $731,400 | $249,200 | $482,200 |
| 2020 | $4,225 | $675,900 | $216,700 | $459,200 |
| 2019 | $4,062 | $675,900 | $216,700 | $459,200 |
| 2018 | $3,620 | $610,800 | $195,900 | $414,900 |
| 2017 | $3,516 | $325,985 | $0 | $0 |
| 2016 | $3,592 | $310,420 | $0 | $0 |
| 2015 | $3,538 | $309,045 | $0 | $0 |
| 2014 | $3,040 | $276,815 | $0 | $0 |
Source: Public Records
Map
Nearby Homes
Your Personal Tour Guide
Ask me questions while you tour the home.