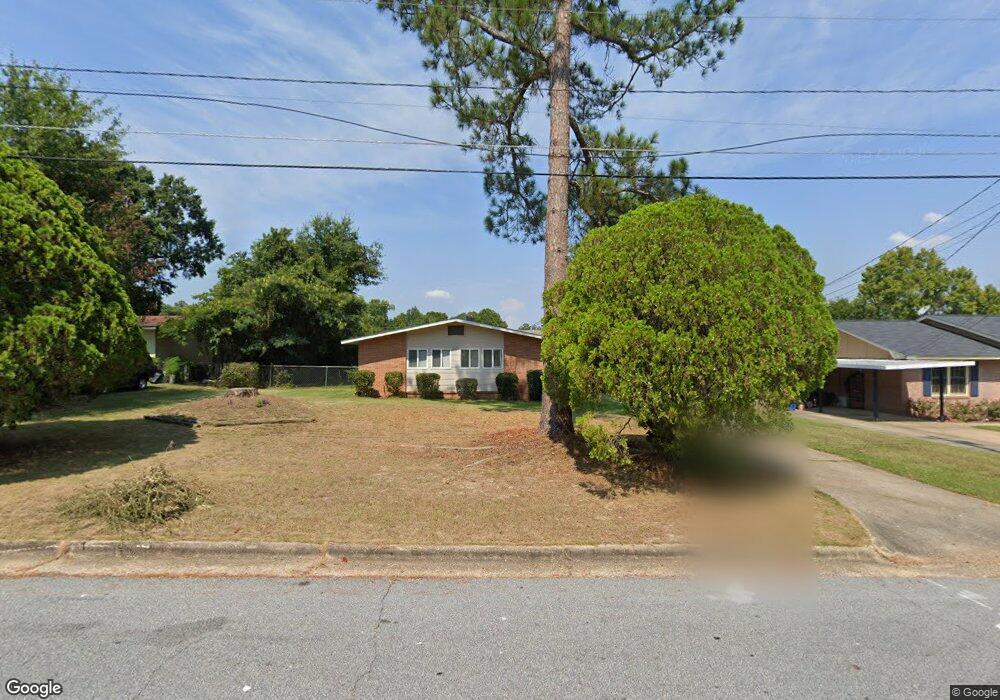
1823 Susan Ln Columbus, GA 31907
Eastern Columbus NeighborhoodEstimated Value: $139,000 - $160,427
3
Beds
3
Baths
1,635
Sq Ft
$92/Sq Ft
Est. Value
About This Home
This home is located at 1823 Susan Ln, Columbus, GA 31907 and is currently estimated at $151,142, approximately $92 per square foot. 1823 Susan Ln is a home located in Muscogee County with nearby schools including Wesley Heights Elementary School, East Columbus Magnet Academy, and Kendrick High School.
Ownership History
Date
Name
Owned For
Owner Type
Purchase Details
Closed on
May 9, 2014
Sold by
Sec Of Housing & U
Bought by
Linlock Llc
Current Estimated Value
Home Financials for this Owner
Home Financials are based on the most recent Mortgage that was taken out on this home.
Original Mortgage
$55,250
Interest Rate
4.43%
Mortgage Type
New Conventional
Purchase Details
Closed on
Apr 2, 2013
Sold by
Branch Banking & Trust C
Bought by
Sec Of Housing & Urban
Purchase Details
Closed on
Sep 26, 2008
Sold by
Bridges Robert and Martin Carlos
Bought by
Martin Diane
Home Financials for this Owner
Home Financials are based on the most recent Mortgage that was taken out on this home.
Original Mortgage
$121,397
Interest Rate
6.49%
Mortgage Type
FHA
Create a Home Valuation Report for This Property
The Home Valuation Report is an in-depth analysis detailing your home's value as well as a comparison with similar homes in the area
Home Values in the Area
Average Home Value in this Area
Purchase History
| Date | Buyer | Sale Price | Title Company |
|---|---|---|---|
| Linlock Llc | $50,251 | -- | |
| Sec Of Housing & Urban | $138,031 | -- | |
| Branch Banking & Trust Co | $138,031 | -- | |
| Martin Diane | $123,000 | None Available |
Source: Public Records
Mortgage History
| Date | Status | Borrower | Loan Amount |
|---|---|---|---|
| Closed | Linlock Llc | $55,250 | |
| Previous Owner | Martin Diane | $121,397 |
Source: Public Records
Tax History Compared to Growth
Tax History
| Year | Tax Paid | Tax Assessment Tax Assessment Total Assessment is a certain percentage of the fair market value that is determined by local assessors to be the total taxable value of land and additions on the property. | Land | Improvement |
|---|---|---|---|---|
| 2025 | $1,703 | $43,495 | $9,040 | $34,455 |
| 2024 | $1,799 | $51,884 | $9,040 | $42,844 |
| 2023 | $162 | $48,328 | $9,040 | $39,288 |
| 2022 | $1,676 | $41,040 | $9,040 | $32,000 |
| 2021 | $1,167 | $28,588 | $9,040 | $19,548 |
| 2020 | $1,127 | $27,600 | $8,280 | $19,320 |
| 2019 | $1,131 | $27,600 | $8,280 | $19,320 |
| 2018 | $1,131 | $27,600 | $8,280 | $19,320 |
| 2017 | $1,240 | $27,600 | $8,280 | $19,320 |
| 2016 | $990 | $24,000 | $4,000 | $20,000 |
| 2015 | $830 | $20,101 | $4,000 | $16,101 |
| 2014 | $1,848 | $49,105 | $4,000 | $45,105 |
| 2013 | -- | $49,105 | $4,000 | $45,105 |
Source: Public Records
Map
Nearby Homes
- 1524 Hagan Dr
- 5619 Valleybrook Rd
- 2249 Mahan Dr
- 2501 White Chapel Dr
- 5500 Amber Dr
- 5833 Gleneden Dr
- 2505 White Chapel Dr
- 2307 Skylake Dr
- 5759 Forrest Rd
- 5834 Blueridge Dr
- 5920 Gleneden Dr
- 6032 Cordova Rd
- 4731 Marino St
- 5929 Gleneden Dr
- 2525 Corineth Dr
- 5542 Teresa St
- 2807 Doyle Ave
- 6047 Capri Cir
- 1068 Valencia Dr
- 6033 Luna Dr