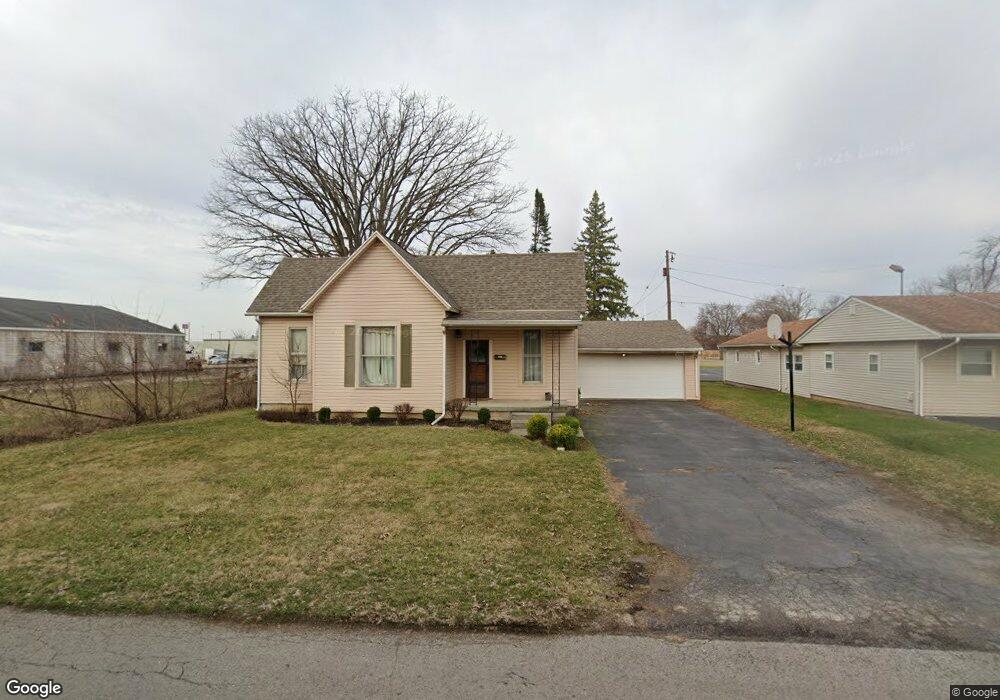
1824 Bolton St Findlay, OH 45840
Estimated Value: $118,000 - $170,000
1
Bed
1
Bath
1,012
Sq Ft
$139/Sq Ft
Est. Value
About This Home
This home is located at 1824 Bolton St, Findlay, OH 45840 and is currently estimated at $141,111, approximately $139 per square foot. 1824 Bolton St is a home located in Hancock County with nearby schools including Northview Elementary School, Bigelow Hill Elementary School, and Glenwood Middle School.
Ownership History
Date
Name
Owned For
Owner Type
Purchase Details
Closed on
Jul 31, 2020
Sold by
Webster Elaine A
Bought by
Craft Nathan K and Craft Denise E
Current Estimated Value
Home Financials for this Owner
Home Financials are based on the most recent Mortgage that was taken out on this home.
Original Mortgage
$71,677
Outstanding Balance
$63,700
Interest Rate
3.1%
Mortgage Type
FHA
Estimated Equity
$77,411
Purchase Details
Closed on
Sep 24, 2015
Bought by
Webster Robert G and Webster Elaine A
Home Financials for this Owner
Home Financials are based on the most recent Mortgage that was taken out on this home.
Interest Rate
3.86%
Purchase Details
Closed on
Jan 21, 1997
Sold by
Webb Bradley
Bought by
Webster Robert and Webster Elaine
Home Financials for this Owner
Home Financials are based on the most recent Mortgage that was taken out on this home.
Original Mortgage
$42,000
Interest Rate
7.01%
Mortgage Type
New Conventional
Purchase Details
Closed on
Dec 30, 1993
Bought by
Webb Bradley A
Create a Home Valuation Report for This Property
The Home Valuation Report is an in-depth analysis detailing your home's value as well as a comparison with similar homes in the area
Home Values in the Area
Average Home Value in this Area
Purchase History
| Date | Buyer | Sale Price | Title Company |
|---|---|---|---|
| Craft Nathan K | $73,000 | Golden Key Title Agency | |
| Webster Robert G | -- | -- | |
| Webster Robert | $65,000 | -- | |
| Webb Bradley A | $38,000 | -- |
Source: Public Records
Mortgage History
| Date | Status | Borrower | Loan Amount |
|---|---|---|---|
| Open | Craft Nathan K | $71,677 | |
| Closed | Webster Robert G | -- | |
| Previous Owner | Webster Robert | $42,000 |
Source: Public Records
Tax History Compared to Growth
Tax History
| Year | Tax Paid | Tax Assessment Tax Assessment Total Assessment is a certain percentage of the fair market value that is determined by local assessors to be the total taxable value of land and additions on the property. | Land | Improvement |
|---|---|---|---|---|
| 2024 | $1,324 | $37,270 | $5,720 | $31,550 |
| 2023 | $1,326 | $37,270 | $5,720 | $31,550 |
| 2022 | $1,329 | $37,270 | $5,720 | $31,550 |
| 2021 | $1,209 | $29,710 | $5,710 | $24,000 |
| 2020 | $1,209 | $29,710 | $5,710 | $24,000 |
| 2019 | $1,355 | $29,710 | $5,710 | $24,000 |
| 2018 | $1,274 | $26,060 | $5,190 | $20,870 |
| 2017 | $1,164 | $26,060 | $5,190 | $20,870 |
| 2016 | $1,157 | $26,060 | $5,190 | $20,870 |
| 2015 | $1,163 | $25,860 | $6,070 | $19,790 |
| 2014 | $1,163 | $25,860 | $6,070 | $19,790 |
| 2012 | $1,172 | $25,860 | $6,070 | $19,790 |
Source: Public Records
Map
Nearby Homes
- 405 Clifton Ave
- 410 Monroe Ave
- 643 Edith Ave
- 304 Rector Ave
- 304 Prentiss Ave
- 905 W Melrose Ave
- 1934 Geffs Ave
- 604 Davis St
- 925 W Melrose Ave
- 1820 N Main St
- 533 Davis St
- 1825 Pershing St
- 1005 Broad Ave
- 2100 Candlewick Dr
- 933 Laurel Ln
- 524 Defiance Ave
- 206 Midland Ave
- 115 George St
- 230 Midland Ave
- 231 Tioga Ave
- 1830 Bolton St
- 533 Rector Ave
- 532 Clifton Ave
- 529 Rector Ave
- 528 Clifton Ave
- 1900 Bolton St
- 525 Rector Ave
- 612 Rector Ave
- 524 Clifton Ave
- 1906 Bolton St
- 532 Rector Ave
- 521 Rector Ave
- 520 Clifton Ave
- 528 Rector Ave
- 533 Clifton Ave
- 620 Rector Ave
- 1912 Bolton St
- 529 Clifton Ave
- 524 Rector Ave
- 517 Rector Ave