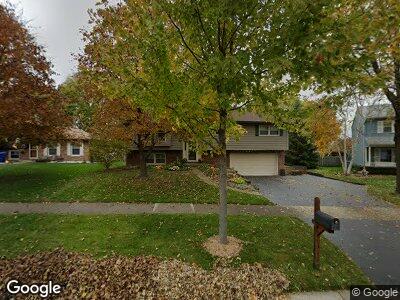
1824 Chandler Ave Saint Charles, IL 60174
Southeast Saint Charles NeighborhoodEstimated Value: $358,000 - $409,000
4
Beds
3
Baths
1,397
Sq Ft
$280/Sq Ft
Est. Value
About This Home
This home is located at 1824 Chandler Ave, Saint Charles, IL 60174 and is currently estimated at $391,125, approximately $279 per square foot. 1824 Chandler Ave is a home located in Kane County with nearby schools including Munhall Elementary School, Wredling Middle School, and St Charles East High School.
Ownership History
Date
Name
Owned For
Owner Type
Purchase Details
Closed on
Jun 12, 2023
Sold by
Straiker Thomas G
Bought by
Thomas G Straiker And Mary P Straiker Family
Current Estimated Value
Purchase Details
Closed on
Aug 22, 1997
Sold by
Winters James T and Winters Stephanie J
Bought by
Straiker Thomas G and Straiker Mary P
Home Financials for this Owner
Home Financials are based on the most recent Mortgage that was taken out on this home.
Original Mortgage
$150,900
Interest Rate
7.56%
Mortgage Type
FHA
Purchase Details
Closed on
Aug 31, 1995
Sold by
Vanwey Barbara A
Bought by
Winters James T and Winters Stephanie J
Home Financials for this Owner
Home Financials are based on the most recent Mortgage that was taken out on this home.
Original Mortgage
$115,000
Interest Rate
7.37%
Create a Home Valuation Report for This Property
The Home Valuation Report is an in-depth analysis detailing your home's value as well as a comparison with similar homes in the area
Home Values in the Area
Average Home Value in this Area
Purchase History
| Date | Buyer | Sale Price | Title Company |
|---|---|---|---|
| Thomas G Straiker And Mary P Straiker Family | -- | None Listed On Document | |
| Straiker Thomas G | $110,666 | Law Title Ins Co | |
| Winters James T | $158,000 | Advanced Title Services Inc |
Source: Public Records
Mortgage History
| Date | Status | Borrower | Loan Amount |
|---|---|---|---|
| Previous Owner | Straiker Thomas G | $147,000 | |
| Previous Owner | Straiker Thomas G | $20,000 | |
| Previous Owner | Straiker Thomas G | $148,828 | |
| Previous Owner | Straiker Thomas G | $150,900 | |
| Previous Owner | Winters James T | $115,000 |
Source: Public Records
Tax History Compared to Growth
Tax History
| Year | Tax Paid | Tax Assessment Tax Assessment Total Assessment is a certain percentage of the fair market value that is determined by local assessors to be the total taxable value of land and additions on the property. | Land | Improvement |
|---|---|---|---|---|
| 2023 | $7,414 | $100,634 | $27,331 | $73,303 |
| 2022 | $6,697 | $88,941 | $26,563 | $62,378 |
| 2021 | $6,425 | $84,779 | $25,320 | $59,459 |
| 2020 | $6,353 | $83,198 | $24,848 | $58,350 |
| 2019 | $6,236 | $81,551 | $24,356 | $57,195 |
| 2018 | $6,016 | $78,528 | $23,429 | $55,099 |
| 2017 | $5,741 | $74,513 | $22,628 | $51,885 |
| 2016 | $6,020 | $71,896 | $21,833 | $50,063 |
| 2015 | -- | $69,118 | $21,598 | $47,520 |
| 2014 | -- | $67,529 | $21,598 | $45,931 |
| 2013 | -- | $69,701 | $21,814 | $47,887 |
Source: Public Records
Map
Nearby Homes
- 1970 Division St
- 831 Chandler Ave
- 1811 Jeanette Ave
- 1378 Arlington Ct Unit 1
- 1348 Arlington Ct
- 1204 Lencioni Ct Unit 4
- 1621 Jeanette Ave
- 1513 Kirkwood Dr
- 1504 Kirkwood Dr
- 1509 Williams Ave
- 1469 Averill Cir
- 1550 Ronzheimer Ave
- 1508 Independence Ave
- 425 Union Ave
- 1606 S 7th Ave
- 1719 S 4th Place
- LOT 209 Austin Ave
- 839 N Bennett St
- 1137 Fern Ave
- 864 N Bennett St
- 1824 Chandler Ave
- 1818 Chandler Ave
- 1830 Chandler Ave
- 1756 Patricia Ln
- 1754 Patricia Ln
- 1812 Chandler Ave
- 1762 Patricia Ln
- 1821 Chandler Ave
- 1836 Chandler Ave
- 1768 Patricia Ln
- 1752 Patricia Ln
- 1806 Division St
- 1815 Chandler Ave
- 1845 Chandler Ave
- 1774 Patricia Ln
- 1842 Chandler Ave
- 1750 Patricia Ln
- 1910 Division St
- 1757 Patricia Ln Unit 4
- 1855 Chandler Ave