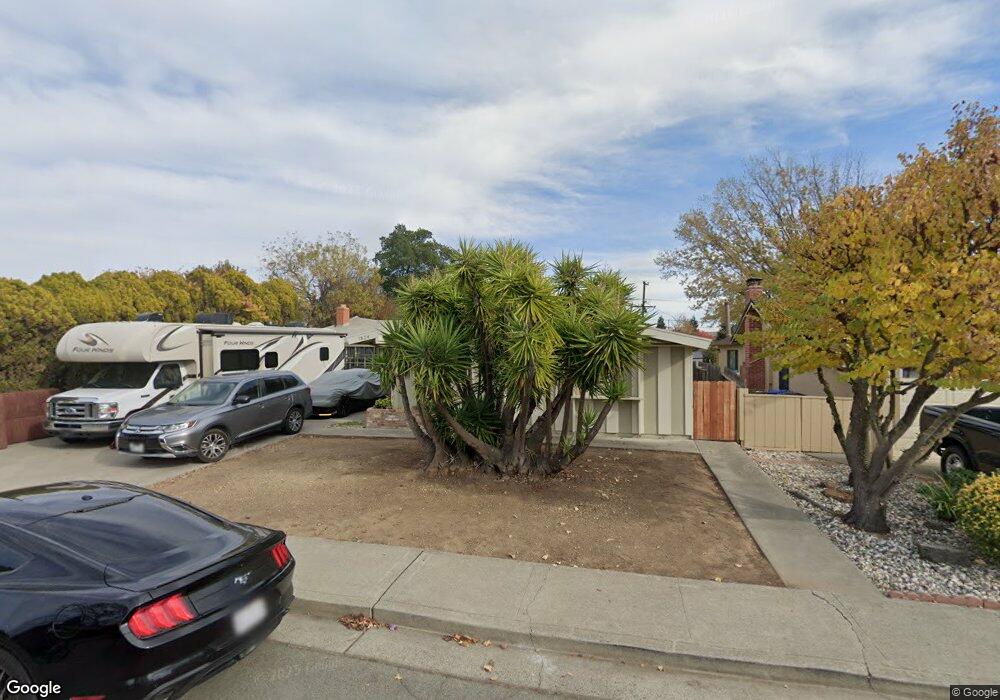
1824 Sycamore Dr Fairfield, CA 94533
Estimated Value: $513,000 - $544,280
4
Beds
3
Baths
1,680
Sq Ft
$315/Sq Ft
Est. Value
About This Home
This home is located at 1824 Sycamore Dr, Fairfield, CA 94533 and is currently estimated at $528,820, approximately $314 per square foot. 1824 Sycamore Dr is a home located in Solano County with nearby schools including Anna Kyle Elementary School, Grange Middle School, and Fairfield High School.
Ownership History
Date
Name
Owned For
Owner Type
Purchase Details
Closed on
May 25, 2018
Sold by
Benson Richard and Benson Espernza
Bought by
Benson Richard
Current Estimated Value
Purchase Details
Closed on
Jul 15, 2015
Sold by
Wickman Enterprises Inc and Fitzgerald Nathan
Bought by
Benson Richard and Benson Esperanza
Home Financials for this Owner
Home Financials are based on the most recent Mortgage that was taken out on this home.
Original Mortgage
$316,650
Outstanding Balance
$246,819
Interest Rate
3.85%
Mortgage Type
VA
Estimated Equity
$282,001
Purchase Details
Closed on
Mar 6, 2015
Sold by
Huguenin Reba M
Bought by
Wickman Enterprises Inc and Fitzgerald Nathan
Purchase Details
Closed on
Mar 5, 2015
Sold by
Fitzgerald Nova
Bought by
Fitzgerald Nathan
Create a Home Valuation Report for This Property
The Home Valuation Report is an in-depth analysis detailing your home's value as well as a comparison with similar homes in the area
Home Values in the Area
Average Home Value in this Area
Purchase History
| Date | Buyer | Sale Price | Title Company |
|---|---|---|---|
| Benson Richard | -- | None Available | |
| Benson Richard | $310,000 | First American Title Company | |
| Wickman Enterprises Inc | $225,000 | First American Title Company | |
| Fitzgerald Nathan | -- | First American Title Company |
Source: Public Records
Mortgage History
| Date | Status | Borrower | Loan Amount |
|---|---|---|---|
| Open | Benson Richard | $316,650 |
Source: Public Records
Tax History
| Year | Tax Paid | Tax Assessment Tax Assessment Total Assessment is a certain percentage of the fair market value that is determined by local assessors to be the total taxable value of land and additions on the property. | Land | Improvement |
|---|---|---|---|---|
| 2025 | $4,107 | $366,969 | $59,186 | $307,783 |
| 2024 | $4,107 | $359,775 | $58,026 | $301,749 |
| 2023 | $3,981 | $352,722 | $56,889 | $295,833 |
| 2022 | $3,932 | $345,807 | $55,774 | $290,033 |
| 2021 | $3,894 | $339,028 | $54,681 | $284,347 |
| 2020 | $3,803 | $335,553 | $54,121 | $281,432 |
| 2019 | $3,709 | $328,974 | $53,060 | $275,914 |
| 2018 | $3,829 | $322,524 | $52,020 | $270,504 |
| 2017 | $3,652 | $316,200 | $51,000 | $265,200 |
| 2016 | $3,624 | $310,000 | $50,000 | $260,000 |
| 2015 | $775 | $68,529 | $14,679 | $53,850 |
| 2014 | -- | $67,188 | $14,392 | $52,796 |
Source: Public Records
Map
Nearby Homes
- 1831 Clay St
- 1724 Fillmore St
- 1712 Arthur Ct
- 219 Wisconsin St
- 751 Hillcrest Ct
- 1667 Vicksburg Dr
- 1669 Rutledge Ln
- 1812 San Jose Place
- 1660 Glenmore Dr
- 519 Pacific Ave
- 1652 Glenmore Dr
- 366 San Andreas St
- 1661 Fairfield Ave
- 1845 San Anselmo St
- 133 E Travis Blvd
- 937 Pacific Ave
- 1500 Harrison St
- 2256 Dorset Ln
- 1541 Rayburn Ct
- 2034 Cambridge Dr
Your Personal Tour Guide
Ask me questions while you tour the home.