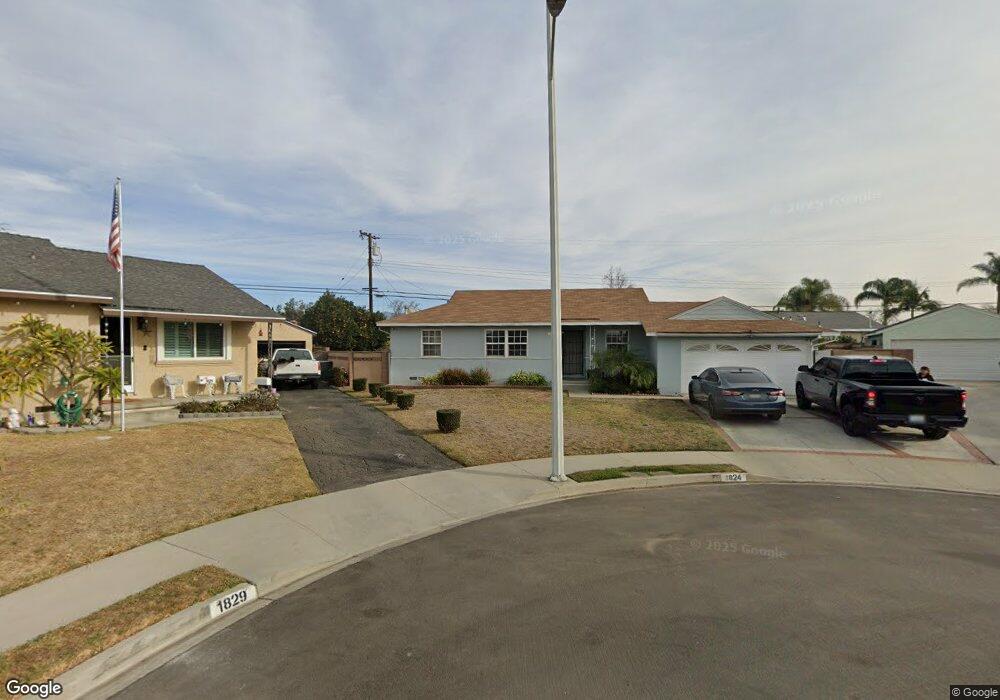
1824 W Corak St West Covina, CA 91790
Estimated Value: $748,787 - $830,000
3
Beds
2
Baths
1,127
Sq Ft
$695/Sq Ft
Est. Value
About This Home
This home is located at 1824 W Corak St, West Covina, CA 91790 and is currently estimated at $783,697, approximately $695 per square foot. 1824 W Corak St is a home located in Los Angeles County with nearby schools including Orangewood Elementary School, Edgewood Middle School, and Edgewood High School.
Ownership History
Date
Name
Owned For
Owner Type
Purchase Details
Closed on
Nov 7, 2023
Sold by
Estrada Manuel
Bought by
Manuel Estrada And Maria Estrada Revocable Li and Estrada
Current Estimated Value
Purchase Details
Closed on
Oct 8, 2008
Sold by
Estrada Maria Luz
Bought by
Estrada Manuel
Purchase Details
Closed on
Oct 6, 2008
Sold by
Hsbc Bank Usa Na
Bought by
Estrada Manuel
Purchase Details
Closed on
Dec 28, 2007
Sold by
Reynoso Irma Y and Reynoso George L
Bought by
Hsbc Bank Usa Na and Ace Securities Corp Home Equity Loan Tru
Purchase Details
Closed on
Dec 14, 2000
Sold by
Friend Michael J and Friend Dong B
Bought by
Reynoso George L and Reynoso Irma Y
Home Financials for this Owner
Home Financials are based on the most recent Mortgage that was taken out on this home.
Original Mortgage
$187,064
Interest Rate
7.54%
Mortgage Type
FHA
Purchase Details
Closed on
Mar 12, 1998
Sold by
Va
Bought by
Friend Michael J and Friend Doug Buu
Create a Home Valuation Report for This Property
The Home Valuation Report is an in-depth analysis detailing your home's value as well as a comparison with similar homes in the area
Home Values in the Area
Average Home Value in this Area
Purchase History
| Date | Buyer | Sale Price | Title Company |
|---|---|---|---|
| Manuel Estrada And Maria Estrada Revocable Li | -- | None Listed On Document | |
| Estrada Manuel | -- | None Available | |
| Estrada Manuel | $300,000 | Lsi Title Fnds Division | |
| Hsbc Bank Usa Na | $335,730 | None Available | |
| Reynoso George L | $190,000 | Chicago Title | |
| Friend Michael J | -- | -- |
Source: Public Records
Mortgage History
| Date | Status | Borrower | Loan Amount |
|---|---|---|---|
| Previous Owner | Reynoso George L | $187,064 |
Source: Public Records
Tax History Compared to Growth
Tax History
| Year | Tax Paid | Tax Assessment Tax Assessment Total Assessment is a certain percentage of the fair market value that is determined by local assessors to be the total taxable value of land and additions on the property. | Land | Improvement |
|---|---|---|---|---|
| 2025 | $4,838 | $386,313 | $245,440 | $140,873 |
| 2024 | $4,838 | $378,739 | $240,628 | $138,111 |
| 2023 | $4,599 | $371,313 | $235,910 | $135,403 |
| 2022 | $4,635 | $364,034 | $231,285 | $132,749 |
| 2021 | $4,505 | $356,897 | $226,750 | $130,147 |
| 2019 | $4,382 | $346,313 | $220,025 | $126,288 |
| 2018 | $4,169 | $339,523 | $215,711 | $123,812 |
| 2016 | $3,811 | $326,341 | $207,336 | $119,005 |
| 2015 | $3,735 | $321,440 | $204,222 | $117,218 |
| 2014 | $3,714 | $315,144 | $200,222 | $114,922 |
Source: Public Records
Map
Nearby Homes
- 1911 W Doublegrove St
- 1816 W Yarnell St
- 1525 Bromley Ave
- 1718 Puente Ave Unit 40
- 1240 S Bromley Ave
- 1528 W Delvale St
- 1529 Cascade
- 1244 S Leland Ave
- 14321 Walnut Creek Pkwy
- 1842 W Merced Ave
- 1820 W Merced Ave
- 1818 W Merced Ave
- 1828 W Merced Ave
- 1822 W Merced Ave
- 1856 W Merced Ave
- Plan 2 at The Grove at Merced
- Plan 1 at The Grove at Merced
- 1735 Puente Ave Unit 30
- 14104 Barrydale St
- 1123 S Sunkist Ave
- 1912 W Glenmere St
- 1828 W Corak St
- 1906 W Glenmere St
- 1920 W Glenmere St
- 1922 W Alwood St
- 1832 W Corak St
- 1901 W Corak St
- 1834 W Glenmere St
- 1923 W Corak St
- 1900 W Corak St
- 1930 W Alwood St
- 1605 S Sandia Ave
- 1609 S Sandia Ave
- 1613 S Sandia Ave
- 1929 W Corak St
- 1828 W Glenmere St
- 1617 S Sandia Ave
- 1913 W Glenmere St
- 1907 W Glenmere St
- 1906 W Corak St