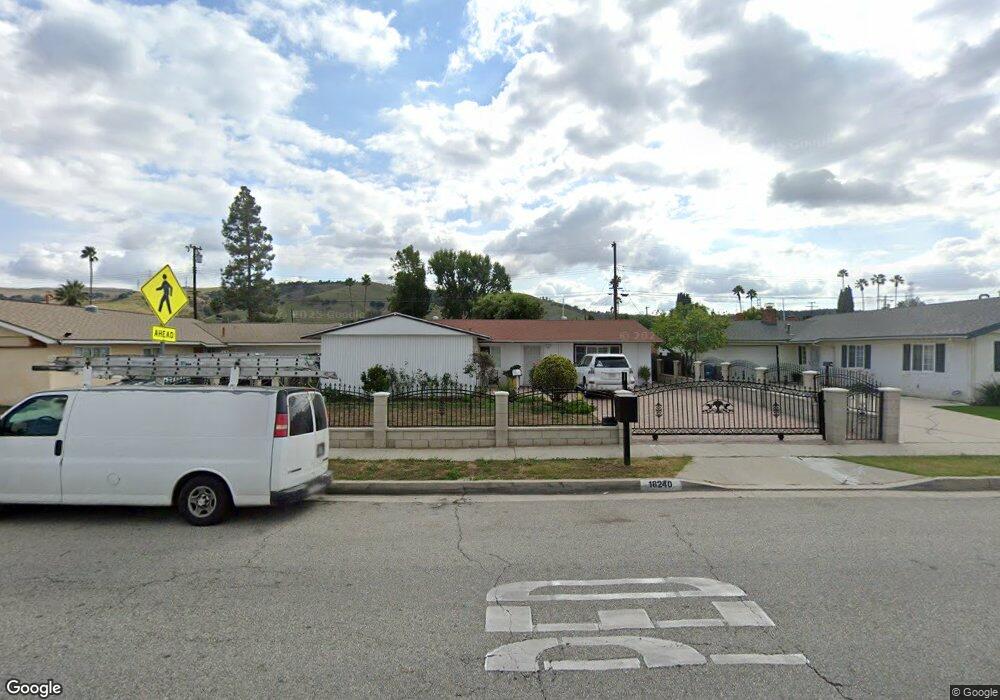
18240 Mescal St Rowland Heights, CA 91748
Estimated Value: $779,489 - $877,000
3
Beds
2
Baths
1,400
Sq Ft
$593/Sq Ft
Est. Value
About This Home
This home is located at 18240 Mescal St, Rowland Heights, CA 91748 and is currently estimated at $830,372, approximately $593 per square foot. 18240 Mescal St is a home located in Los Angeles County with nearby schools including Rowland Elementary School, Alvarado Intermediate School, and John A. Rowland High School.
Ownership History
Date
Name
Owned For
Owner Type
Purchase Details
Closed on
Jan 16, 2023
Sold by
Chung Fei Han
Bought by
Goodhome Living Trust
Current Estimated Value
Purchase Details
Closed on
Nov 7, 2018
Sold by
Fei Adams
Bought by
Fei Han Chung and Chen Sheng Hua
Purchase Details
Closed on
May 7, 2015
Sold by
Fei Han Chung and Chen Sheng Hua
Bought by
Fei Adams
Purchase Details
Closed on
Oct 11, 2014
Sold by
Fel Han Chung and Chen Sheng Hua
Bought by
Fei Han Chung and Chen Sheng Hua
Purchase Details
Closed on
Apr 30, 2002
Sold by
Li Chi Mao and Li Kuan Chan Chang
Bought by
Fei Han Chung C and Fei Sheng Hua Chen
Home Financials for this Owner
Home Financials are based on the most recent Mortgage that was taken out on this home.
Original Mortgage
$172,500
Interest Rate
6.37%
Create a Home Valuation Report for This Property
The Home Valuation Report is an in-depth analysis detailing your home's value as well as a comparison with similar homes in the area
Home Values in the Area
Average Home Value in this Area
Purchase History
| Date | Buyer | Sale Price | Title Company |
|---|---|---|---|
| Goodhome Living Trust | -- | -- | |
| Fei Han Chung | -- | Accommodation | |
| Fei Adams | -- | None Available | |
| Fei Han Chung | -- | None Available | |
| Fei Han Chung C | $230,000 | First American Title Co |
Source: Public Records
Mortgage History
| Date | Status | Borrower | Loan Amount |
|---|---|---|---|
| Previous Owner | Fei Han Chung C | $172,500 |
Source: Public Records
Tax History Compared to Growth
Tax History
| Year | Tax Paid | Tax Assessment Tax Assessment Total Assessment is a certain percentage of the fair market value that is determined by local assessors to be the total taxable value of land and additions on the property. | Land | Improvement |
|---|---|---|---|---|
| 2025 | $4,482 | $339,756 | $218,777 | $120,979 |
| 2024 | $4,482 | $333,095 | $214,488 | $118,607 |
| 2023 | $4,337 | $326,565 | $210,283 | $116,282 |
| 2022 | $4,239 | $320,162 | $206,160 | $114,002 |
| 2021 | $4,164 | $313,885 | $202,118 | $111,767 |
| 2019 | $4,040 | $304,576 | $196,124 | $108,452 |
| 2018 | $3,832 | $298,605 | $192,279 | $106,326 |
| 2016 | $3,678 | $287,012 | $184,813 | $102,199 |
| 2015 | $3,618 | $282,701 | $182,037 | $100,664 |
| 2014 | $3,613 | $277,165 | $178,472 | $98,693 |
Source: Public Records
Map
Nearby Homes
- 18220 Gallineta St
- 2426 Batson Ave
- 18239 Villa Clara St
- 18479 Aguiro St
- 18536 Mescal St
- 2474 Patrician View Ave
- 2521 Doubletree Ln
- 2503 Toro Dr
- 2306 Doubletree Ln
- 2503 Donosa Dr
- 2330 Donosa Dr
- 18620 Mescalero St
- 2010 La Cueva Dr
- 18654 Del Bonita St
- 2503 Abonado Place
- 2634 Blandford Dr
- 17812 Gallineta St
- 18131 Camino Bello Unit 4
- 1902 Jellick Ave
- 17834 Calle Los Arboles
- 18246 Mescal St
- 18234 Mescal St
- 18249 La Guardia St
- 18252 Mescal St
- 18228 Mescal St
- 18245 La Guardia St
- 18239 La Guardia St
- 18261 La Guardia St
- 18243 Mescal St
- 18249 Mescal St
- 18300 Mescal St
- 18222 Mescal St
- 18237 Mescal St
- 18255 Mescal St
- 18267 La Guardia St
- 18231 Mescal St
- 18235 La Guardia St
- 18306 Mescal St
- 18216 Mescal St
- 18301 Mescal St