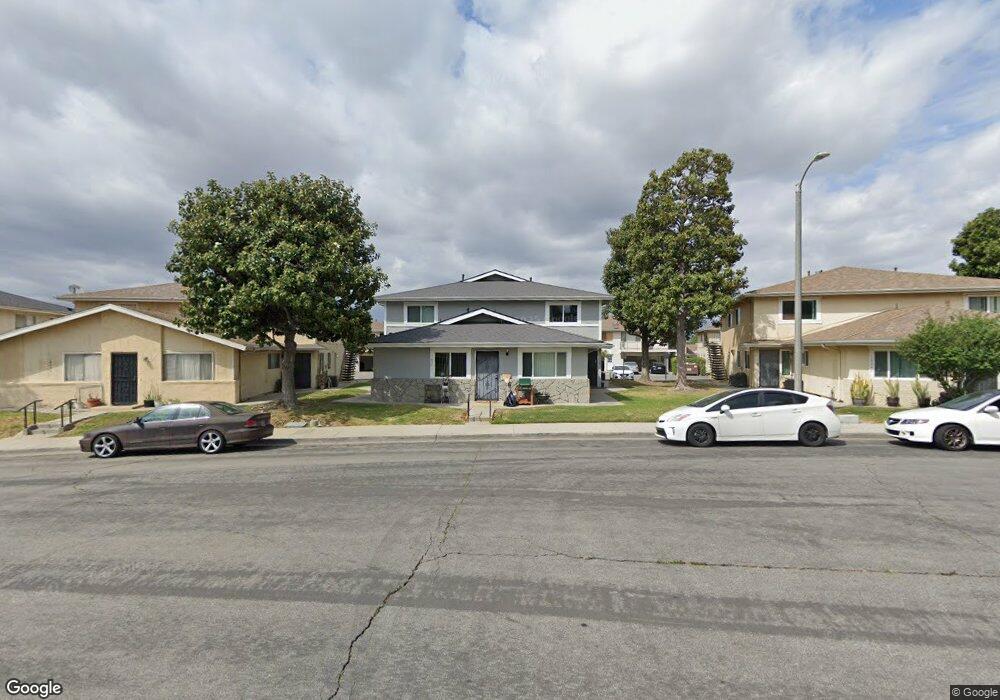
18241 Via Calma Unit 3 Rowland Heights, CA 91748
Estimated Value: $426,000 - $530,000
2
Beds
1
Bath
836
Sq Ft
$542/Sq Ft
Est. Value
About This Home
This home is located at 18241 Via Calma Unit 3, Rowland Heights, CA 91748 and is currently estimated at $452,755, approximately $541 per square foot. 18241 Via Calma Unit 3 is a home located in Los Angeles County with nearby schools including Rowland Elementary School, Alvarado Intermediate School, and John A. Rowland High School.
Ownership History
Date
Name
Owned For
Owner Type
Purchase Details
Closed on
Jul 29, 2004
Sold by
Maglunog Eymard Buendia and Maglunog Liberty Deguzman
Bought by
Alejandro Edward C and Alejandro Archidona N
Current Estimated Value
Home Financials for this Owner
Home Financials are based on the most recent Mortgage that was taken out on this home.
Original Mortgage
$187,000
Outstanding Balance
$92,423
Interest Rate
5.95%
Mortgage Type
Purchase Money Mortgage
Estimated Equity
$360,332
Purchase Details
Closed on
May 22, 2002
Sold by
Yau Kek Eng and Yau Swee Ai
Bought by
Maglunog Eymard Buendia and Maglunog Liberty Deguzman
Home Financials for this Owner
Home Financials are based on the most recent Mortgage that was taken out on this home.
Original Mortgage
$104,500
Interest Rate
6.51%
Purchase Details
Closed on
Oct 17, 1995
Sold by
Seah Ah Ho
Bought by
Yau Kek Eng and Yau Swee Ai
Create a Home Valuation Report for This Property
The Home Valuation Report is an in-depth analysis detailing your home's value as well as a comparison with similar homes in the area
Home Values in the Area
Average Home Value in this Area
Purchase History
| Date | Buyer | Sale Price | Title Company |
|---|---|---|---|
| Alejandro Edward C | $220,000 | American Title Company Fulle | |
| Maglunog Eymard Buendia | $110,000 | Investors Title Company | |
| Yau Kek Eng | -- | -- |
Source: Public Records
Mortgage History
| Date | Status | Borrower | Loan Amount |
|---|---|---|---|
| Open | Alejandro Edward C | $187,000 | |
| Previous Owner | Maglunog Eymard Buendia | $104,500 |
Source: Public Records
Tax History Compared to Growth
Tax History
| Year | Tax Paid | Tax Assessment Tax Assessment Total Assessment is a certain percentage of the fair market value that is determined by local assessors to be the total taxable value of land and additions on the property. | Land | Improvement |
|---|---|---|---|---|
| 2025 | $3,937 | $306,640 | $199,878 | $106,762 |
| 2024 | $3,937 | $300,628 | $195,959 | $104,669 |
| 2023 | $3,806 | $294,734 | $192,117 | $102,617 |
| 2022 | $3,720 | $288,955 | $188,350 | $100,605 |
| 2021 | $3,656 | $283,290 | $184,657 | $98,633 |
| 2019 | $3,544 | $274,889 | $179,181 | $95,708 |
| 2018 | $3,403 | $269,500 | $175,668 | $93,832 |
| 2016 | $3,005 | $236,000 | $153,000 | $83,000 |
| 2015 | $2,997 | $236,000 | $153,000 | $83,000 |
| 2014 | $2,614 | $199,000 | $129,000 | $70,000 |
Source: Public Records
Map
Nearby Homes
- 1912 Tomas Ct
- 18186 Rio Seco Dr
- 1808 Via Entrada
- 1902 Jellick Ave
- 2010 La Cueva Dr
- 2474 Patrician View Ave
- 18239 Villa Clara St
- 18220 Gallineta St
- 17834 Calle Los Arboles
- 1971 Via Tranquilo
- 18716 Greengate St
- 2362 Cuatro Dr
- 2306 Doubletree Ln
- 18620 Mescalero St
- 18557 Mescal St
- 2426 Batson Ave
- 2330 Donosa Dr
- 18536 Mescal St
- 2453 Fullerton Rd
- 17812 Gallineta St
- 18241 Via Calma Unit 4
- 18241 Via Calma
- 18241 Via Calma Unit 2
- 18235 Via Calma Unit 4
- 18235 Via Calma Unit 2
- 18235 Via Calma
- 18247 Via Calma Unit 2
- 18247 Via Calma Unit 4
- 18247 Via Calma Unit 3
- 18247 Via Calma Unit 1
- 18229 Via Calma Unit 4
- 18229 Via Calma Unit 3
- 18229 Via Calma Unit 2
- 18229 Via Calma
- 18226 Camino Bello Unit 4
- 18226 Camino Bello Unit 3
- 18226 Camino Bello Unit 2
- 18226 Camino Bello Unit 1
- 18236 Camino Bello Unit 4
- 18236 Camino Bello Unit 3