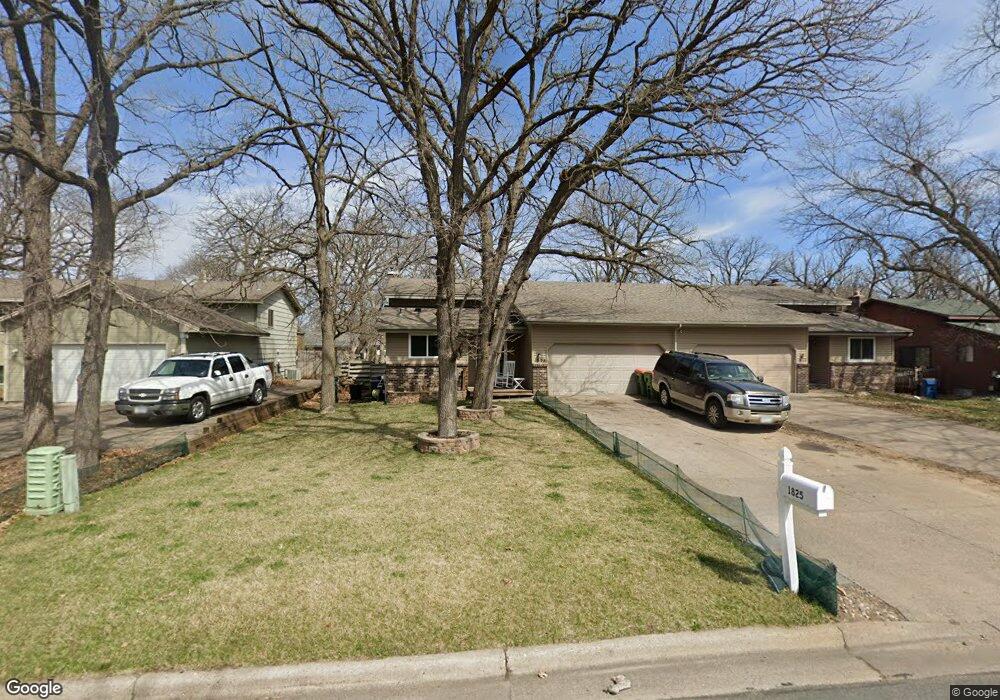
1825 105th Ln NW Coon Rapids, MN 55433
Estimated Value: $262,000 - $277,393
3
Beds
2
Baths
1,900
Sq Ft
$142/Sq Ft
Est. Value
About This Home
This home is located at 1825 105th Ln NW, Coon Rapids, MN 55433 and is currently estimated at $269,598, approximately $141 per square foot. 1825 105th Ln NW is a home located in Anoka County with nearby schools including Lucile Bruner Elementary School, Hoover Elementary School, and Laughlin Junior/Senior High School.
Ownership History
Date
Name
Owned For
Owner Type
Purchase Details
Closed on
May 6, 2016
Sold by
Hamilton Robin R
Bought by
Ruch David and Ruch Sarah
Current Estimated Value
Home Financials for this Owner
Home Financials are based on the most recent Mortgage that was taken out on this home.
Original Mortgage
$147,283
Outstanding Balance
$117,247
Interest Rate
3.66%
Mortgage Type
FHA
Estimated Equity
$152,351
Purchase Details
Closed on
Sep 29, 2009
Sold by
Select Equity Investments
Bought by
Hamilton Robin
Create a Home Valuation Report for This Property
The Home Valuation Report is an in-depth analysis detailing your home's value as well as a comparison with similar homes in the area
Home Values in the Area
Average Home Value in this Area
Purchase History
| Date | Buyer | Sale Price | Title Company |
|---|---|---|---|
| Ruch David | $150,000 | Gibraltar Title Agency Llc | |
| Hamilton Robin | $75,000 | -- |
Source: Public Records
Mortgage History
| Date | Status | Borrower | Loan Amount |
|---|---|---|---|
| Open | Ruch David | $147,283 |
Source: Public Records
Tax History Compared to Growth
Tax History
| Year | Tax Paid | Tax Assessment Tax Assessment Total Assessment is a certain percentage of the fair market value that is determined by local assessors to be the total taxable value of land and additions on the property. | Land | Improvement |
|---|---|---|---|---|
| 2025 | $2,437 | $247,200 | $50,000 | $197,200 |
| 2024 | $2,437 | $243,800 | $50,000 | $193,800 |
| 2023 | $2,202 | $230,000 | $50,000 | $180,000 |
| 2022 | $2,030 | $233,500 | $50,000 | $183,500 |
| 2021 | $2,039 | $194,900 | $40,000 | $154,900 |
| 2020 | $2,018 | $191,300 | $35,000 | $156,300 |
| 2019 | $1,732 | $182,600 | $35,000 | $147,600 |
| 2018 | $1,590 | $156,100 | $0 | $0 |
| 2017 | $1,403 | $141,600 | $0 | $0 |
| 2016 | $1,713 | $125,600 | $0 | $0 |
| 2015 | -- | $125,600 | $24,100 | $101,500 |
| 2014 | -- | $124,600 | $18,600 | $106,000 |
Source: Public Records
Map
Nearby Homes
- 1900 Coon Rapids Blvd NW Unit 1
- 10634 Hummingbird St NW
- 10658 Hummingbird St NW
- 2001 103rd Ln NW
- 2201 108th Ave NW
- 1547 Coon Rapids Blvd NW
- 11036 Hanson Blvd NW Unit 20
- 10239 Raven St NW
- 1285 105th Ave NW
- 10136 Uplander St NW
- 11000 Swallow St NW
- 1285 103rd Ln NW
- 2400 108th Ave NW
- 10648 Wren St NW
- 9967 Egret Blvd NW
- 10200 Mississippi Blvd NW
- 10309 Yukon St NW
- 10616 Arrowhead St NW
- 11267 Robinson Dr NW
- 1025 105th Ave NW
- 1821 105th Ln NW
- 1845 105th Ln NW
- 1819 105th Ln NW
- 1826 106th Ave NW
- 1830 106th Ave NW
- 1822 106th Ave NW
- 1815 105th Ln NW
- 1855 105th Ln NW
- 1834 106th Ave NW
- 1820 106th Ave NW
- 1855 105th Ln NW
- 1855 105th Ln NW
- 1811 105th Ln NW
- 1816 106th Ave NW
- 1838 106th Ave NW
- 1875 105th Ln NW
- 1809 105th Ln NW
- 1810 106th Ave NW
- 1842 106th Ave NW
- 1808 106th Ave NW